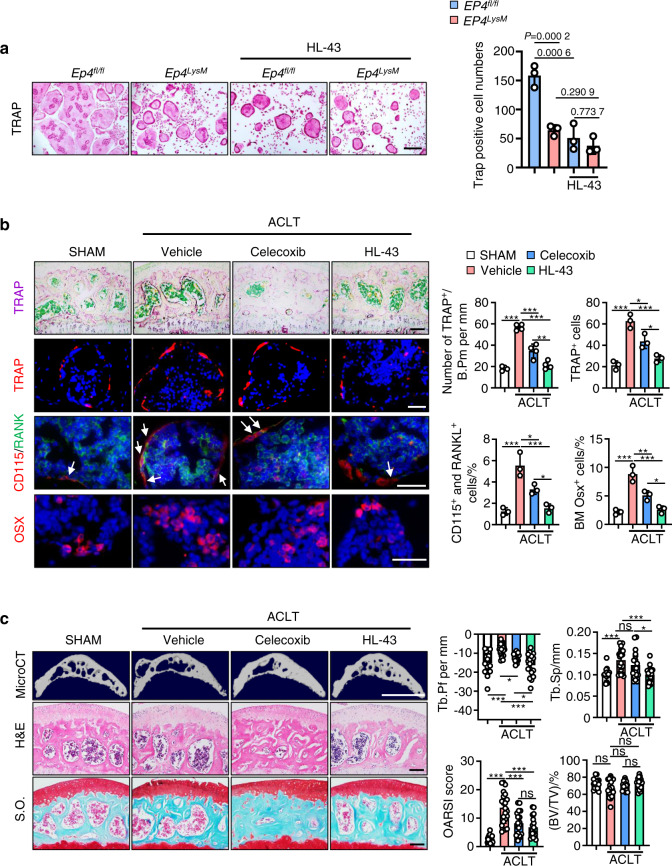
Fig. 5.
The EP4 antagonist HL-43 inhibits OA progression in a murine OA model. a HL-43 inhibits PGE2-induced osteoclast differentiation. BMMs from the EP4fl/fl mice and littermate EP4fl/fl: LysM-cre mice (EP4LysM) were used to generate osteoclasts by stimulation with 10 ng·mL−1 M-CSF and 50 ng·mL−1 RANKL and incubation with 100 nmol·L−1 PGE2 in the presence and absence of HL-43 (10 μmol·L−1). Representative images of TRAP staining are on the left, and the corresponding quantification is on the right. Error bars are the mean ± s.d. n = 3. Two-way ANOVA followed by Tukey’s t tests. Scale bars, 50 μm. b Representative images of TRAP staining and IHF staining of TRAP (red), Osx (red), CD115 (red), and RANK (green) in the subchondral bone of the WT mice orally treated with the FDA-approved OA pain drug celecoxib (30 mg·kg−1) or HL-43 (30 mg·kg−1) 2 weeks after ACLT surgery (left) and quantitative analysis (right). The white arrows indicate CD115 and RANK double-positive osteoclast precursors. Error bars are the mean ± s.d. *P < 0.05, **P < 0. 01 and ***P < 0.001 by one-way ANOVA followed by Tukey’s t tests. n = 4 for TRAP staining, n = 3 for TRAP IHF staining, n = 3 for CD115 and RANK IHF staining, n = 3 for Osx IHC staining. Scale bars, 50 μm (TRAP staining), 20 μm (TRAP IHF staining), 20 μm (CD115 and RANK IHF staining) and 20 μm (Osx IHF staining). c Representative 3D reconstructed microCT images, H&E staining, and S.O. staining of articular cartilage of the WT mice treated with celecoxib or HL-43 8 weeks after ACLT surgery (left). Mice were orally treated daily with celecoxib (30 mg·kg−1) or HL-43 (30 mg·kg−1) for 8 weeks. Quantitative analysis of structural parameters of subchondral bone, including Tb.Pf, Tb.Sp, and BV/TV. OARSI scores based on S.O. staining histology analysis (right). Error bars are the mean ± s.d. *P < 0.05, **P < 0.01 and ***P < 0.001, ns, not significant by one-way ANOVA followed by Tukey’s t tests. n = 17 for the sham group, n = 21 for the vehicle-treated group, n = 18 for the celecoxib-treated group, n = 18 for the HL-43-treated group. Scale bars, 1 mm (microCT), 50 μm (H&E) and 50 μm (S.O.)

