
Figure 2.
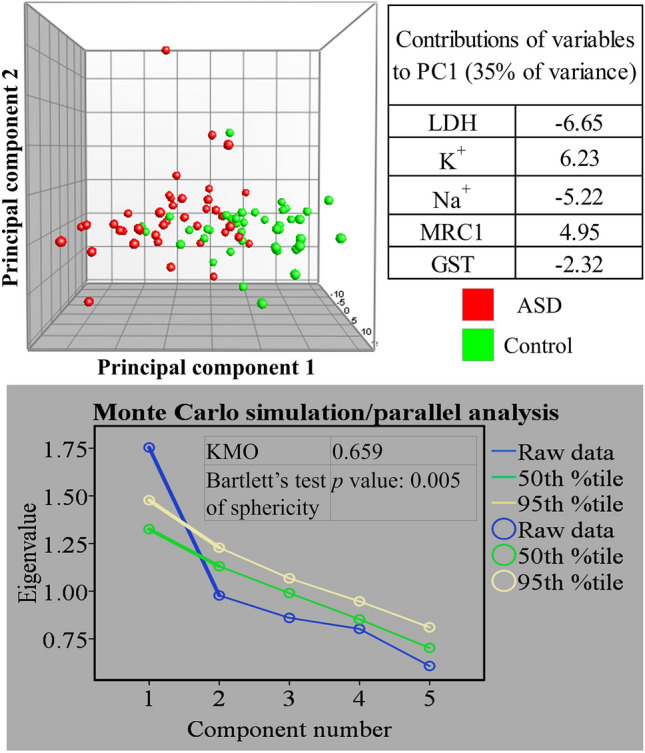
Separation of ASD (n = 40) and age-matched healthy (n = 40) subjects using principal component analysis. The analysis was performed using five variables: potassium (K), sodium (Na), lactate dehydrogenase (LDH), glutathione S-transferase (GST), and mitochondrial respiratory chain complex I (MRC1). Table (top right) shows variable contributions to the first principal component. Graph (bottom) shows the results of Monte Carlo simulation with eigenvalues plotted for raw data and 50th and 95th percentile simulated data. Results of Kaiser–Meyer–Olkin measure of sampling adequacy (KMO) and Bartlett’s test of sphericity are indicated. Figure panels were compiled in Microsoft PowerPoint Slide Presentation Software, Microsoft 365, Microsoft.com. PCA panel (top) was generated in BioNumerics version 6.6, Applied Maths, Austin, Texas, https://www.bionumerics.com. Monte Carlo simulation panel (bottom) was generated in IBM SPSS Statistics for Windows, Version 27.0, IBM Corp., Armonk, New York, https://www.ibm.com.