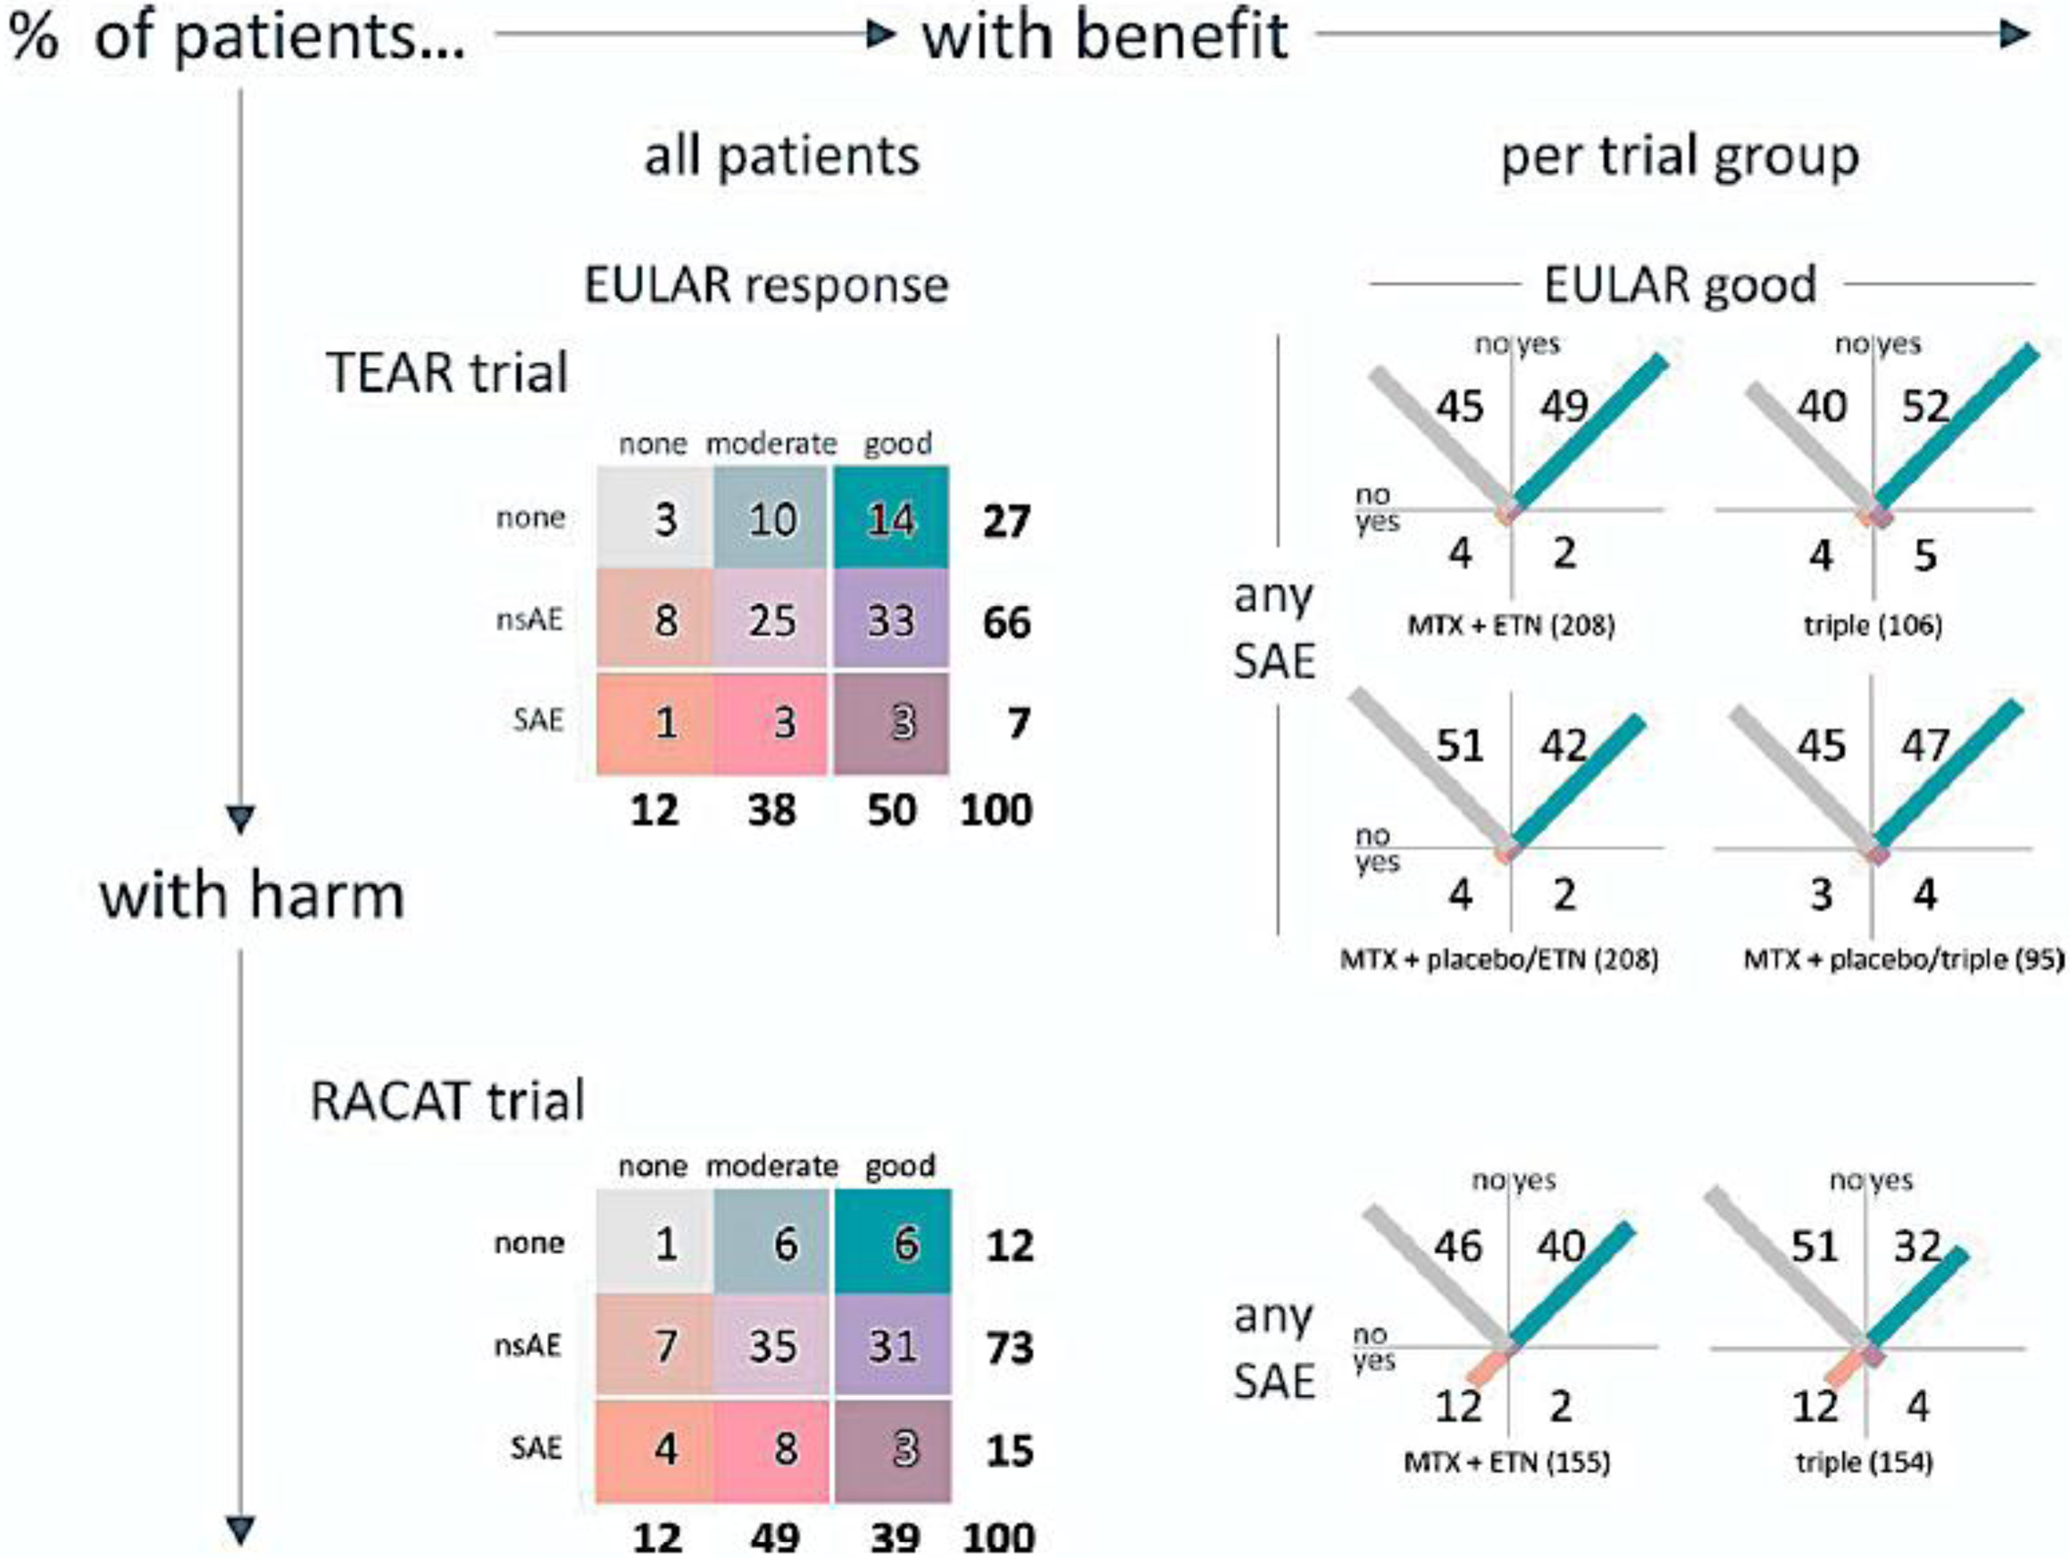
Figure 1.

Figure 1 is reproduced from a previous publication [12] and copyright permissions were approved by Figure 1 is reproduced from a previous publication and copyright permissions were approved by Wiley.
The figure illustrates the OMERACT 3×3 Combined Table of Benefits and Risks assessment method [12]. The results represented in the figure are from two randomized controlled trials including the Treatment of Early Aggressive Rheumatoid Arthritis (TEAR) trial (Top Panel) and the Rheumatoid Arthritis Comparison of Active Therapies (RACAT) trial (Bottom Panel). In the panels on the left, results of treatment groups are pooled and categorized according to the combined occurrence of benefit and harm, each in 3 categories. Results are expressed as a percentage of the total group, corrected for rounding. White lines delineate the cutoffs for the 2×2 categorization in the right-hand panels. The panels on the right show the results (percent per treatment group) with the combined occurrence of benefit and harm, each in 2 categories: for benefit, the European League Against Rheumatism (EULAR) good response (yes/no); for harm, the occurrence of any serious adverse event (SAE; yes/no). The length of the diagonal bar in each cell is proportional to the percentage of patients in that cell. The orange/blue (bottom left to top right) diagonal shows the balance between worst and best outcomes. The light grey/purple (top left to bottom right) diagonal shows the balance between 2 types of tradeoff: no benefit + no harm, and benefit + harm. nsAE (non-SAE); MTX (methotrexate); ETN (etanercept); triple (MTX, sulfasalazine, hydroxychloroquine).
