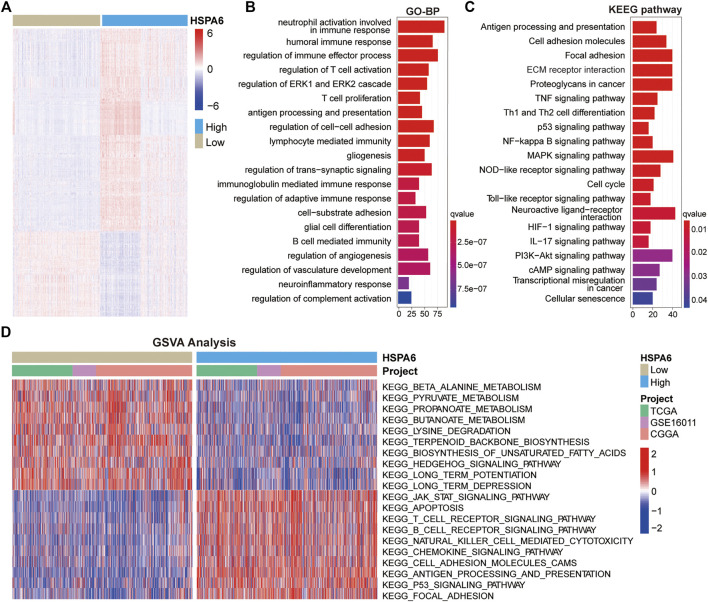
FIGURE 3.
Functional annotation of subgroups with high and low expression levels of HSPA6. (A) Differentially expressed genes (DEGs) between the subgroups of patients with low and high HSPA6 expression were identified by the Wilcoxon rank sum test in the TCGA cohort (FDR < 0.05 and log2Fold Change >1) cohort. (B,C) GO (Gene Ontology) and KEGG (Kyoto Encyclopedia of Genes and Genomes) enrichment analysis for DEGs (p < 0.05 and q < 0.05). There were 1669 DEGs in the TCGA cohort. (D) GSVA (Gene Set Variation Analysis) in the TCGA cohort, Chinese Glioma Genome Atlas (CGGA) cohort, and GSE16011 cohort, as determined by Gene Expression Omnibus (red = high score, blue = low score).

