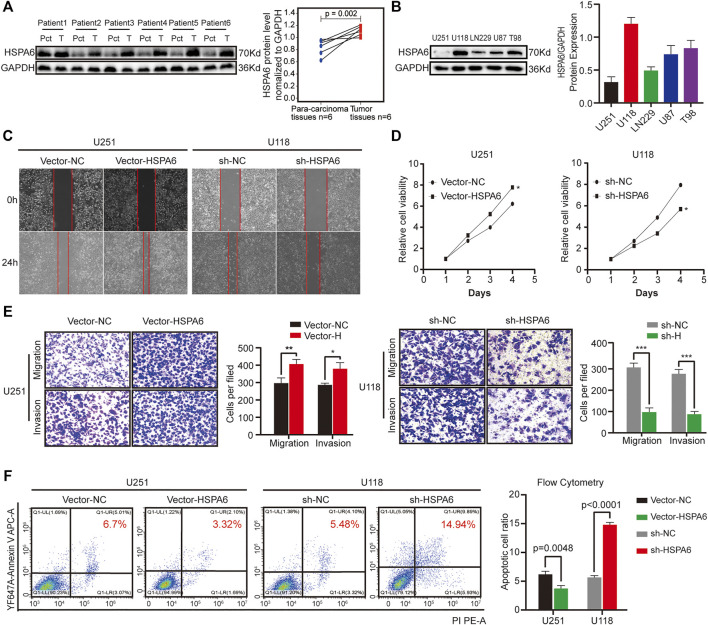
FIGURE 4.
Expression verification of HSPA6 in clinical brain tissues and different glioma cell lines and experimental validation of HSPA6 in U251 and U118 cells. (A) Western blot showing HSPA6 expression in six paired glioma tissues and matched para-carcinoma tissues from the same patient. HSPA6 protein expression levels were quantified by ImageJ software. (B) Western blot of HSPA6 expression in different glioma cell lines. HSPA6 protein expression levels were quantified by ImageJ software. (C) Cell scratch test to detect the migration ability of U251 and U118 cells which had been transfected with Vector-NC or Vector-HSPA6 and the sh-NC or sh-HSPA6 plasmids. The width of the wound was photographed under a microscope (magnification, 100x). (D) Cell Counting Kit-8 (CCK-8) assays were used to detect the proliferation of U251 and U118 cells which had been transfected with Vector-NC or Vector-HSPA6 and the sh-NC or sh-HSPA6 plasmids. (E) Transwell assays of U251 and U118 cells which had been transfected with Vector-NC or Vector-HSPA6 and sh-NC or sh-HSPA6 plasmids. Representative photographs (magnification, 200×) of migratory or invading cells on the membrane coated with or without Matrigel. Quantitative analysis of Transwell assays was performed by ImageJ software. (F) Flow cytometry detection of apoptosis in U251 and U118 cells which had been transfected with Vector-NC or Vector-HSPA6 and sh-NC or sh-HSPA6 plasmids. The proportion of apoptotic cells was equal to the sum of the proportion of early and late apoptosis. Data are expressed as the mean ± SEM from three independent experiments, *p < 0.05, **p < 0.01, ***p < 0.001.

