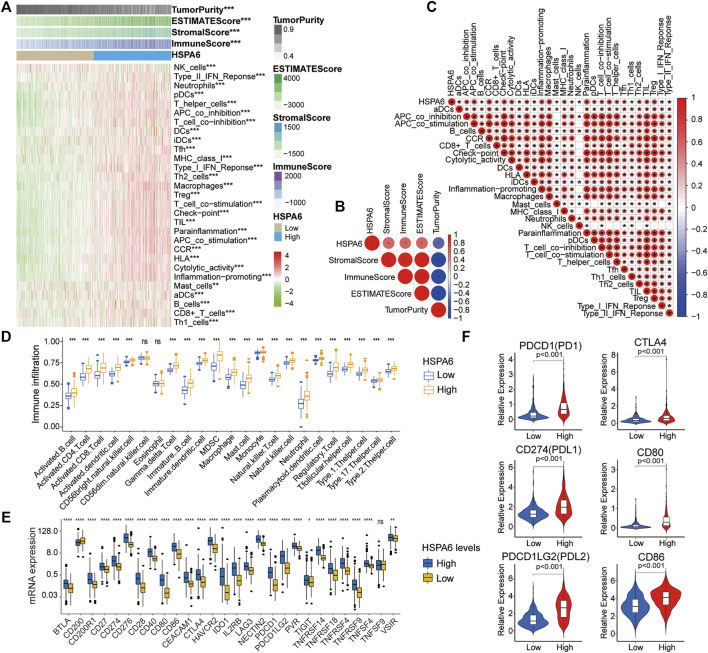
FIGURE 6.
Different tumor microenvironment (TME) characteristics of the two subgroups in the TCGA cohort. (A–C) Correlations of HSPA6 expression with 29 immune-associated gene sets, immune score, stromal score, ESTIMATE score, and tumor purity. (D) Different abundances of TIICs when compared between subgroups of patients with low and high expression levels of HSPA6. (E) Differential analysis of several immune checkpoint (ICP) expression levels between patients with low and high HSPA6 expression levels. (F) Differential expression of different immune checkpoint receptors and ligands between the two subgroups. Correlation analysis was performed by Pearson’s correlation analysis. ns, p > 0.05, *p < 0.05, **p < 0.01, ***p < 0.001, ****p < 0.0001.

