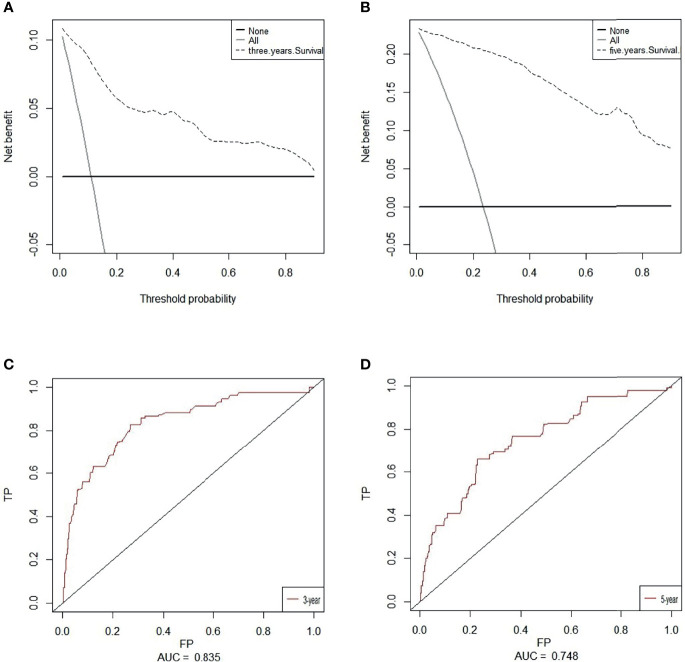
Figure 6.
Decision curve analysis (DCA) of the nomogram of based on 3-year (A) and 5-year (B) overall survival. The x-axis and the y-axis were the threshold probability and the net benefit, respectively. Receiver operating characteristic (ROC) analyses of the nomogram based on 3-year (C) and 5-year (D) overall survival.

