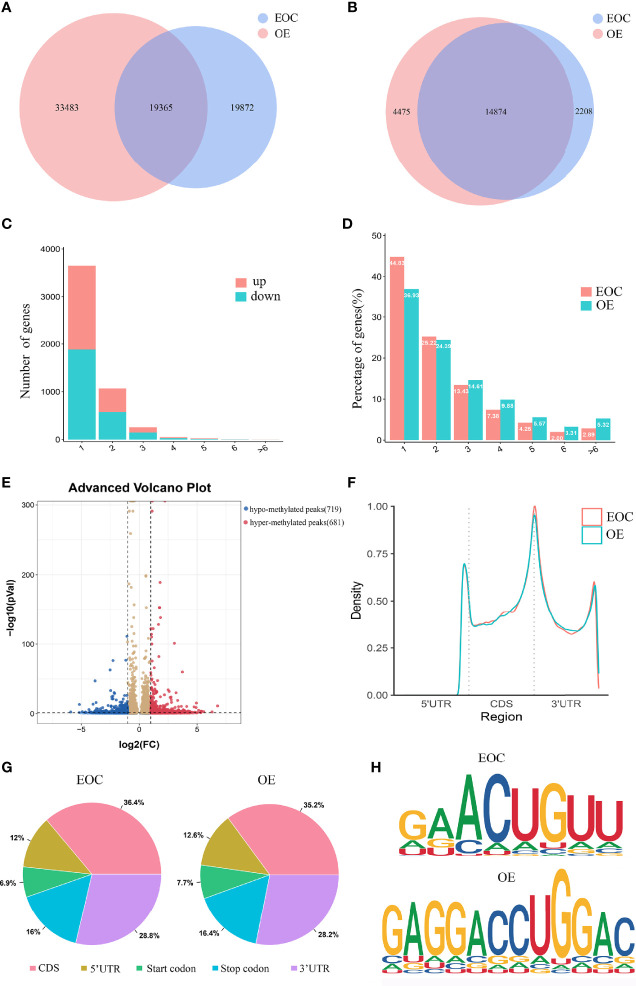
Figure 1.
Characteristics of m6A distributions in EOC and OE. (A) Venn diagrams of overlaps of m6A peaks and (B) genes in EOC and OE tissues. (C) The distribution of differentially modified m6A peaks with significance per gene. (D) Number of peaks per gene in EOC and OE tissues. (E) Volcano plots showing the significant differential m6A peaks in EOC samples compared with OE samples. (F) The distribution and difference in the density of m6A peaks along all the transcripts in EOC and OE. (G) Pie charts showing the distributions of m6A peaks in EOC and OE tissues. (H) Representative m6A motifs enriched from the altered m6A peaks in EOC and OE groups, with P-values of 1*e-166 and 1*e-247, respectively.

