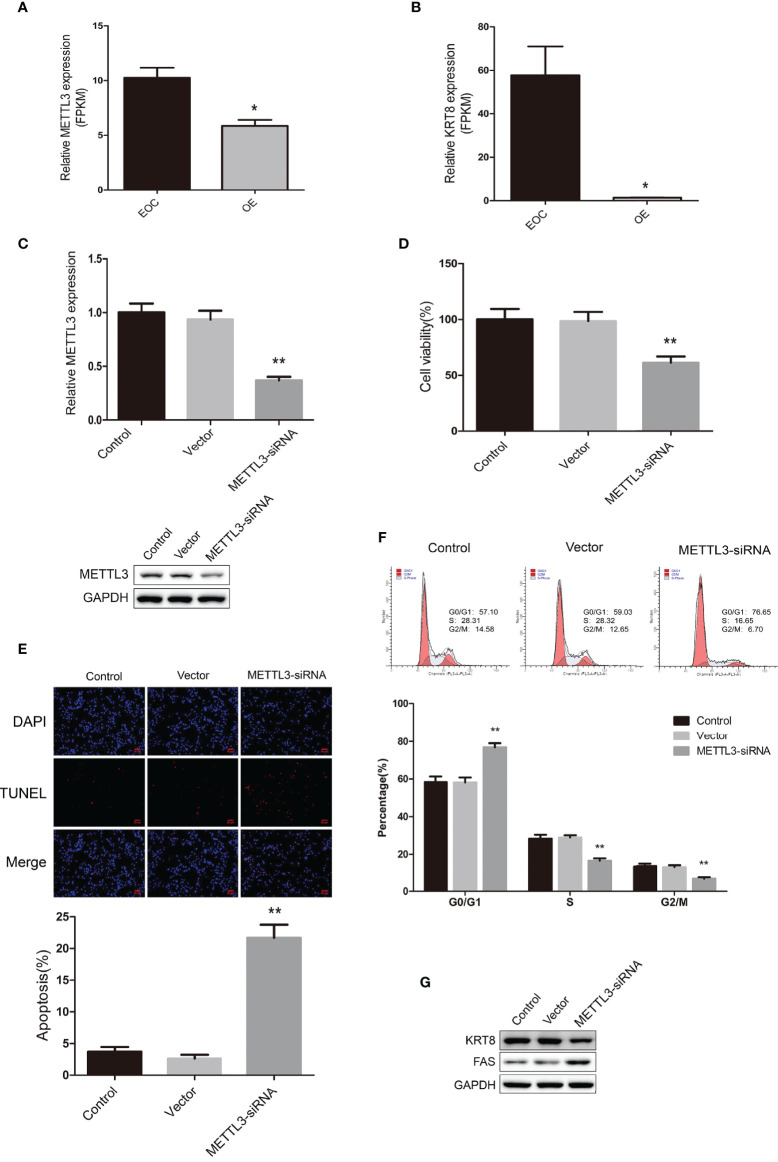
Figure 5.
(A) The relative mRNA expression level of METTL3 in EOC and OE groups. (B) The relative mRNA expression level of KRT8 in EOC and OE groups. (C) Real-time PCR analysis and western blot analysis for METTL3 expression in COV362 untreated cells (Control), cells transfected with empty vector (Vector), and cells transfected with METTL3-siRNA (METTL3-siRNA). (D) MTT assay showing cell viability of Control, Vector and METTL3-siRNA cells. (E) The TUNEL assay showing the apoptosis rates of Control, Vector and METTL3-siRNA cells. (F) Cell cycle analysis of Control, Vector and METTL3-siRNA cells. (G) Western blot showing the expression levels of KRT8 and FAS in Control, Vector and METTL3-siRNA cells. * P < 0.05, ** Compared with the other groups, P < 0.01.

