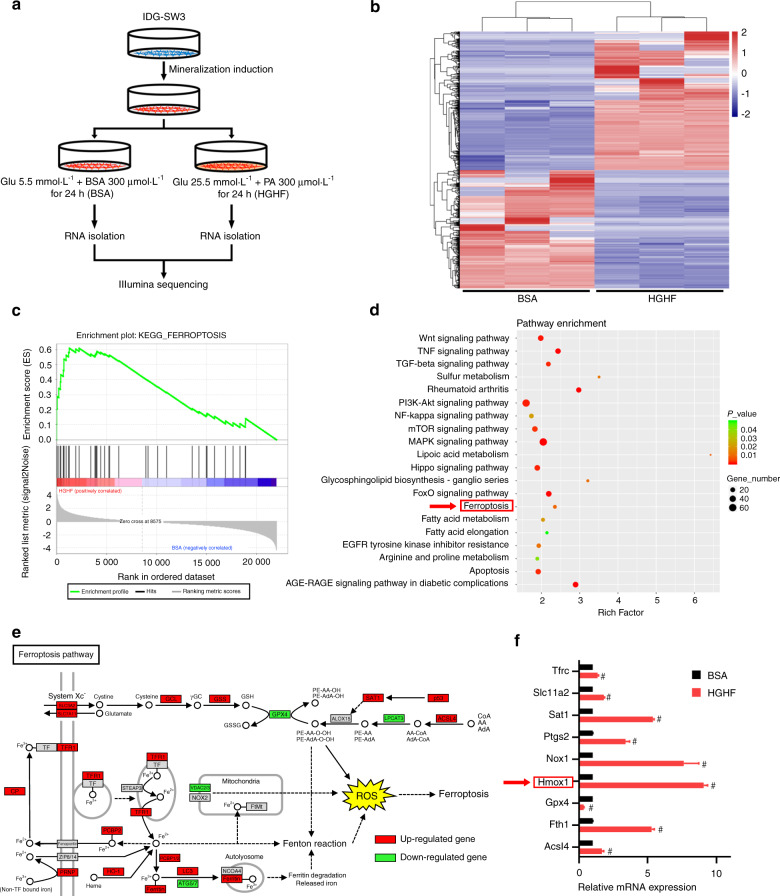
Fig. 3.
HGHF treatment activated ferroptosis and promoted HO-1 expression in osteocytes. a Schematic illustration of the experimental design and procedure for sample preparation for RNA sequencing. b Heatmap showing differentially expressed genes between the BSA and HGHF groups of osteocytes. Red: high expression levels. Blue: low expression levels. c GSEA enrichment plot for the ferroptosis pathway (normalized enrichment score = 2.11; FDR q value < 0.001) based on RNA sequencing. d KEGG pathway enrichment analysis of the differentially expressed genes between the BSA and HGHF groups. e KEGG database visualization of ferroptosis pathway-associated genes affected by HGHF treatment in osteocytes. Red: high expression levels. Green: low expression levels. f The mRNA levels of several ferroptosis-related genes were measured using RT–qPCR in BSA-treated and HGHF-treated osteocytes. The β-actin gene was used as the internal reference gene. #P < 0.01. All data are from n = 3 independent experiments

