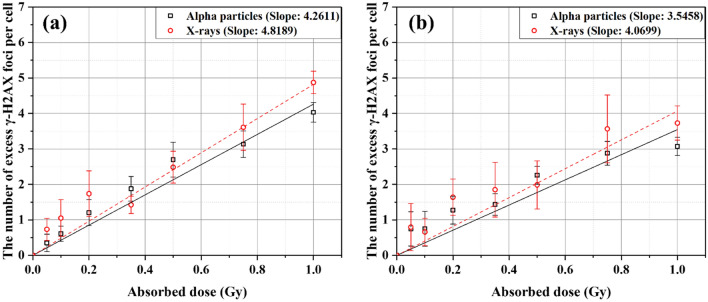
Figure 1.
The numbers of excess γ-H2AX foci per cell in (a) BEAS-2B cells and (b) SVEC4-10EHR1 cells due to exposures to alpha particles (squares) and X-rays (circles) at 1 h post-irradiation. Linear fitting was made for each data set from exposures to alpha particles (solid) and X-rays (dashed) (R2 > 0.95). The slopes are given in “the number of excess foci per cell per Gy”. Each data point was obtained from four independent experiments.

