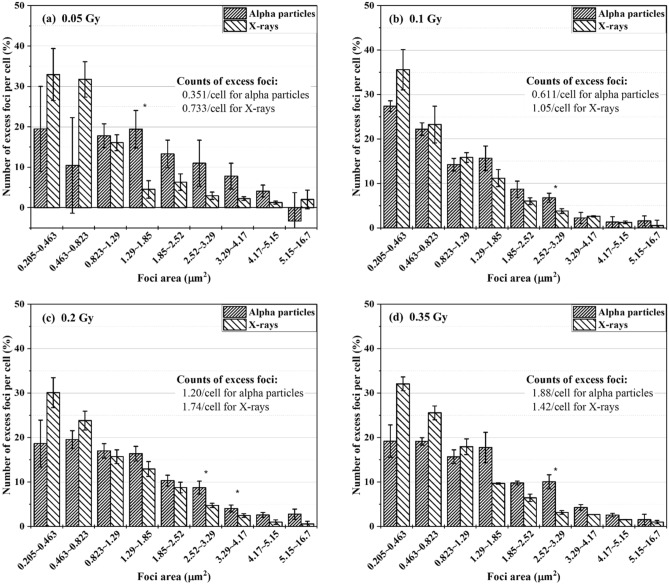
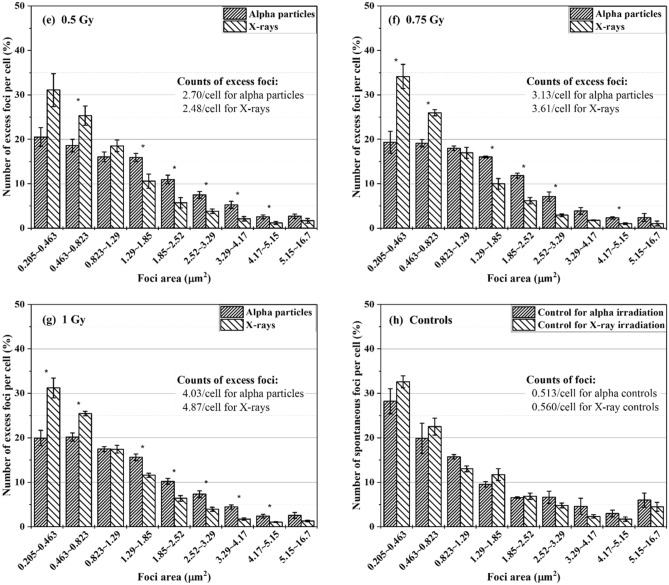
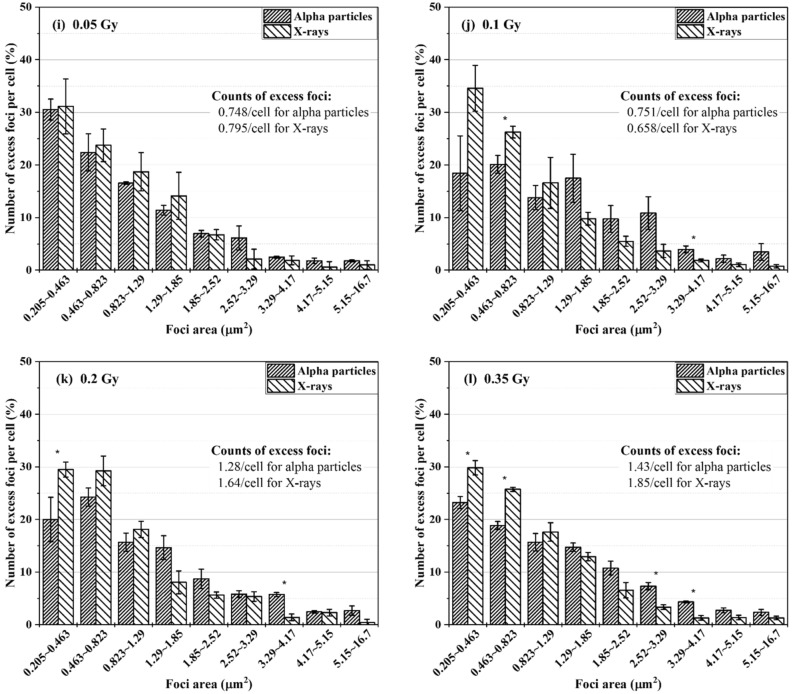
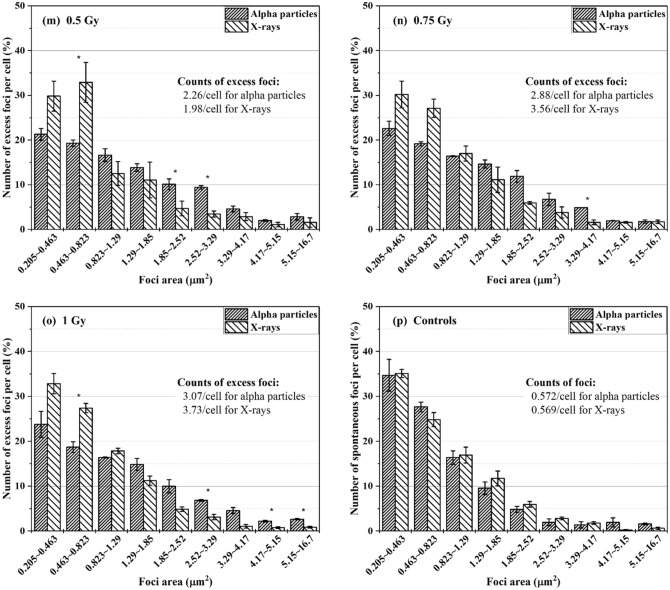
Figure 2.
The size distributions of excess γ-H2AX foci in BEAS-2B (a–g) and SVEC4-10EHR1 (i–o) cells exposed to 0.05 to 1 Gy of alpha particles and X-rays at 1 h post-irradiation as compared to the size distributions of spontaneous γ-H2AX foci in control BEAS-2B (h) and SVEC4-10EHR1 (p) cells. The data was collected an hour after irradiation. The asterisks indicate the size groups for which the percentage significantly (p < 0.05) differs depending on the radiation type. Each data point was obtained from four independent experiments.


