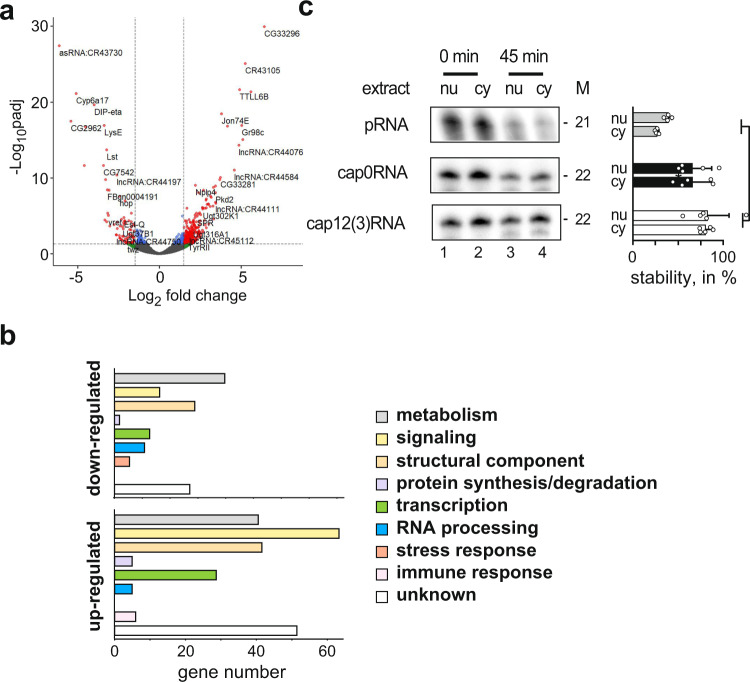
Fig. 3. Impact of mRNA cap-adjacent 2′-O-ribose methylation on gene expression and RNA stability.
a Volcano plot depicting differentially expressed genes in CMTr113A; CMTr2M32 double mutant flies compared to control flies. b Functional classification of upregulated (bottom) and downregulated (top) genes in CMTr113A; CMTr2M32 double mutant flies compared to control flies. c Incubation of monophosphorylated RNA (pRNA, gray) and capped RNA with (white) or without 2′-O-ribose methylation of cap-adjacent nucleotides (black) in nuclear (nu) and cytoplasmic (cy) extracts from S2 cells. M: length in nucleotides. The graph to the right depicts the percent undegraded RNA left after 45 min as mean ± SE (n = 5, except n = 4 for pRNA, p = 0.03 by one way ANOVA followed by Tukey’s test). Source data for gel and RNA stability values are provided as a Source Data file.

