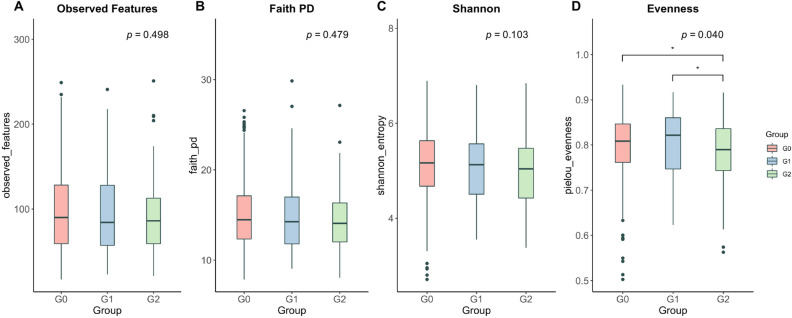
Figure 2.
Alpha diversity of the microbiota among the renal stone groups. Boxplots representing alpha diversity include the observed features (A), Faith's phylogenetic diversity (B), Shannon's index (C), and Pielou's evenness (D) of the three groups. Statistics were calculated using a pairwise Kruskal–Wallis test among the three groups. The p-values were corrected using the Benjamini–Hochberg false discovery rate (FDR) (*p < 0.05). Boxes indicate the interquartile range (IQR) of the 25th to 75th percentiles. The median value is shown as a line within the box, and the whiskers extend to the most extreme value within 1.5 × IQR. Possible outliers are shown as dots. G0: no renal stones (control); G1: incidental renal stones; and G2: prevalent renal stones.

