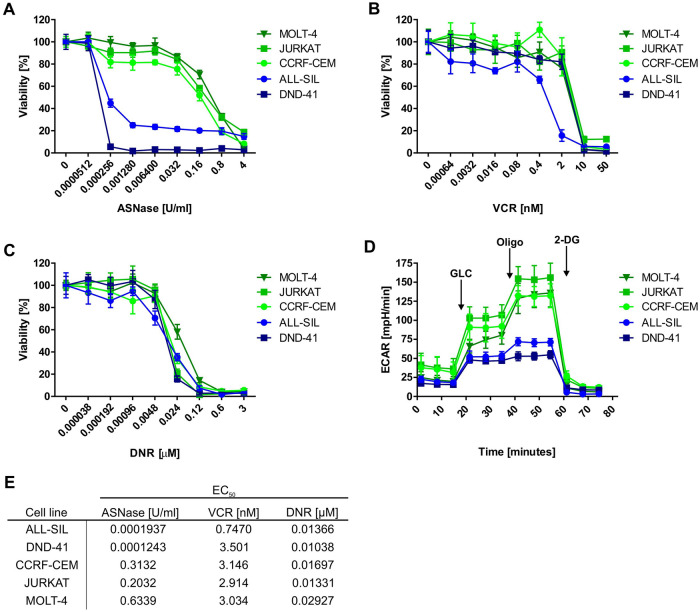
Figure 1.
T-ALL cell lines: Sensitivity to cytostatic drugs and glycolytic profile. Sensitivity of T-ALL cell lines to (A) ASNase, (B) VCR and (C) DNR based on MTS assays. (D) Glycolytic profile of T-ALL cell lines was determined using Seahorse XFp analyzer and Glycolysis Stress Test. (E) EC50 values of ASNase, VCR and DNR in T-ALL cell lines. MTS assays were done at least in biological triplicates and six technical replicates. The Seahorse measurements were done at least in biological triplicates and six technical replicates. All the results are presented as a mean ± SD.

