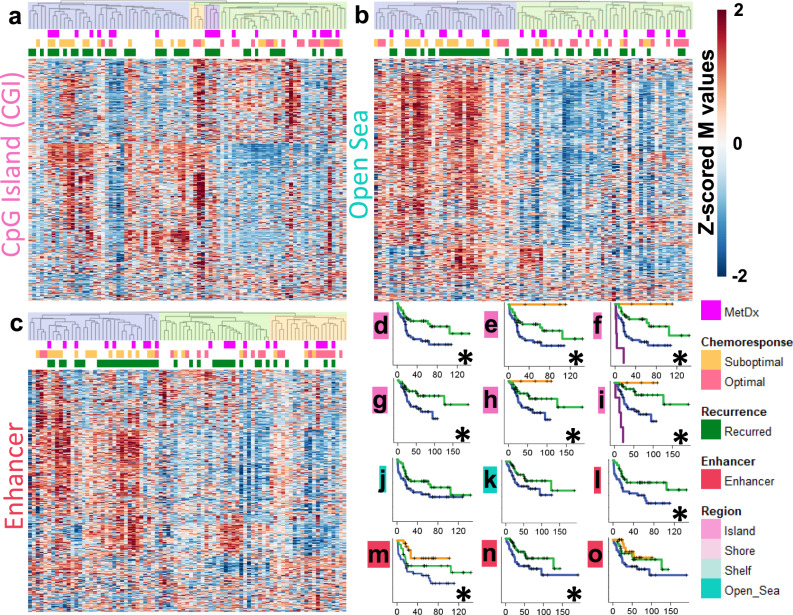
Fig. 2. Methylation patterns of genomic regions.
a Unsupervised hierarchical cluster analysis using CGI methylation (R indices = 0.83, 0.92, and 0.80 for 2, 3, and 4 groups, respectively). b Cluster analysis using Open Sea methylation (R index = 0.72 for 2 groups). c Cluster analysis using Enhancer methylation (R index = 0.80/0.76 for 2 and 3 groups respectively). d–f RFS analysis of the 2, 3, and 4 primary CGI clusters (Log-Rank p = 0.009, 0.015, and 6.7 × 10⁻⁷, respectively). g–i OS analysis of the 2, 3, and 4 primary CGI clusters (Log-Rank p = 0.016, 0.036, and 3.2 × 10⁻⁸, respectively). j RFS analysis of the 2 primary Open Sea clusters (Log-Rank p = 0.074). k OS analysis of the 2 primary Open Sea clusters (Log-Rank p = 0.084). l, m RFS analysis of the 2 and 3 primary Enhancer clusters (Log-Rank p = 0.008, and 0.015, respectively). n, o OS analysis of the 2 and 3 primary Enhancer clusters (Log-Rank p = 0.045, and 0.116, respectively). Significant survival differences (log-rank p < 0.05 are marked with an *).

