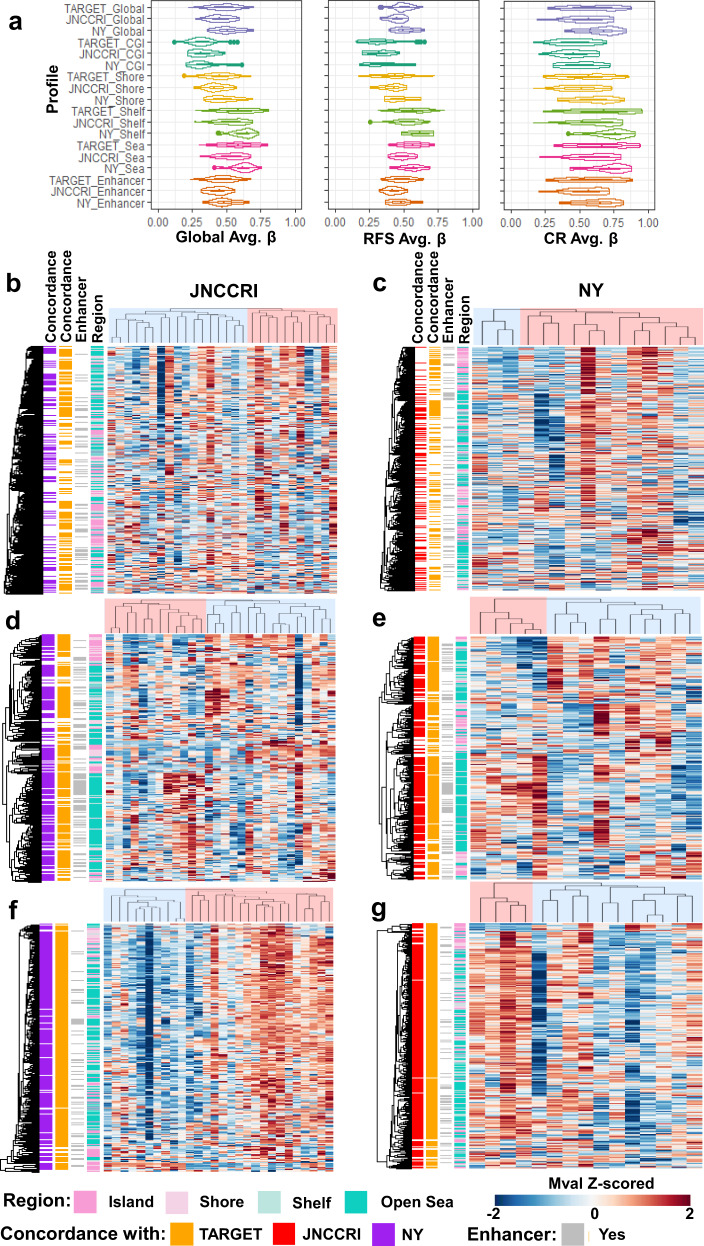
Fig. 5. Methylation profiles in two independent 450k array OSA datasets.
a Average β value distributions of Global, RFS, and CR profiles and region-specific subsets. Semi-supervised hierarchical clustering of the Global profile (b, c), RFS profile (d, e), and CR profile (f, g) in the JNNCRI (left) and NY (right) datasets. CpG sites displaying concordant hypo/hyper-methylation patterns between the independent 450k array datasets are annotated in the first two row annotation tracks of each heatmap. Detailed concordance and differentia methylation results between the cluster groups are presented in Supplementary Table 4.

