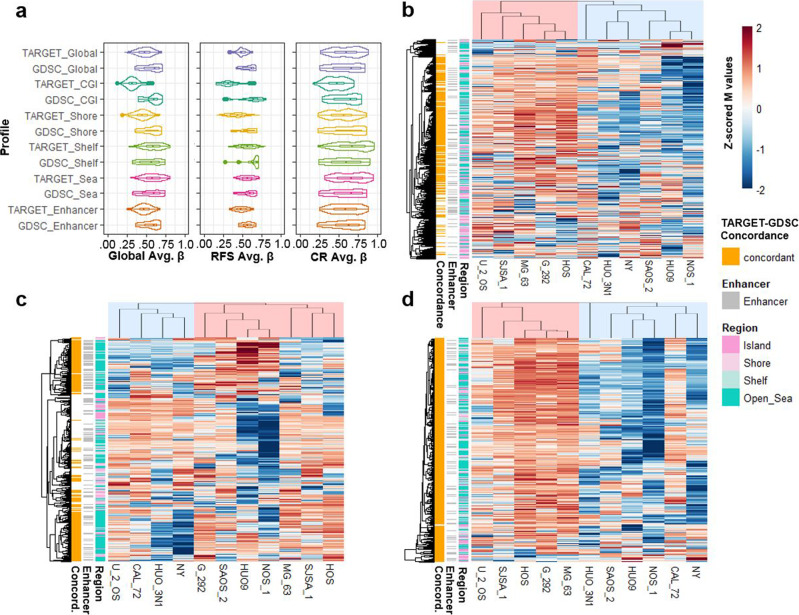
Fig. 9. Methylation profiles in OSA cell lines.
a Violin plots of the average β value distributions of the Global, RFS, and CR profiles and region-specific subsets in the GDSC cell lines and TARGET (for comparison) datasets. Boxplots depict the median, interquartile range (IQR), and 1.5 * IQR. b–d Semi-supervised hierarchical clustering of the 11 OSA cell lines in the GDSC dataset using the Global (b), RFS (c), and CR (d) profiles. CpG sites displaying concordant hypo/hyper-methylation patterns in the cell line GDSC dataset relative to the TARGET clinical dataset are annotated in the first row annotation track of each heatmap. Detailed concordance results are presented in Supplementary Table 6.

