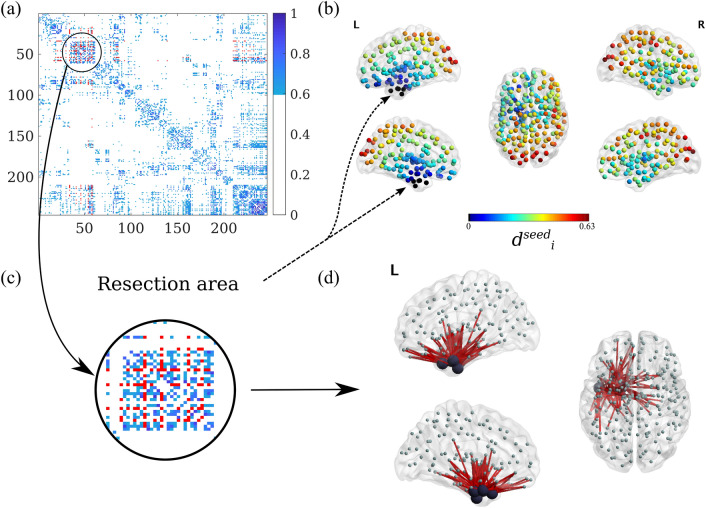
Figure 1.
Individual Brain Networks. (a) Weighted (and thresholded) resting-state broadband-MEG connectivity matrix for patient 4, for . Each entry corresponds to a BNA region, and the regions have been re-ordered to group regions in the same hemisphere. In this representation, ROIs 1-105 correspond to the left cortical regions, ROIs 106-210 to the right cortical regions and ROIs 211-246 to the subcortical regions (in alternating hemisphere order). The strength of each connection is indicated by the colorcode. In red we show the connections from and to the resection area (RA). (b) Distribution of average distances to the RA according to eq. (S2) for patient 4, in dimensionless units. The points mark the centroids of the BNA ROIs, and the color scale indicates the effective distance of the ROI to the resection area (RA), which appears as black dots. (c) Zoom-in of the adjacency matrix: RA and surrounding nodes. (d) Illustrative representation of the RA (big black circles) and all the links connecting it with the rest of the network. Figures with brain representations have been obtained with the BrainNet Viewer78.

