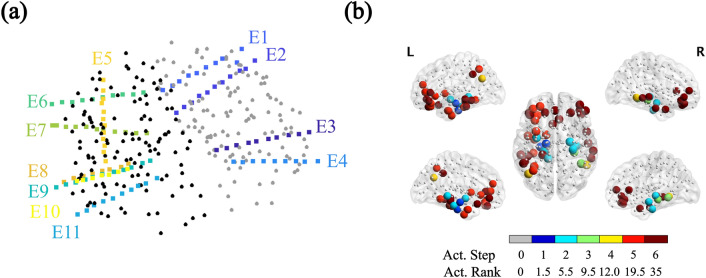
Figure 2.
Individualized Seizure Propagation Pattern. (a) SEEG electrodes for patient 4. Black and gray dots indicate the BNA ROIs’ mass centers, respectively for the left and right hemispheres (different colors are used for visualization purposes). This patient had 11 intracranial electrodes implanted, each electrode is shown in a different color. (b) Corresponding seizure pattern constructed from the clinical SEEG recordings. First, different activation steps were identified in the seizure recordings, together with the corresponding contact points (CPs). In the case depicted here, typical seizures consisted of 6 propagation steps, with step 1 depicting the seizure onset zone (as indicated by the SEEG recordings), and step 6 signalling the generalization of the seizure to all sampled CPs (note however that in general not all CPs need take part in the seizure propagation pattern). This propagation pattern was then translated into the BNA space, and the sampled ROIs are indicated here as large colored spheres. Thus, only the BNA ROIs sampled by the SEEG electrodes are included in the pattern, which in this case corresponded to a total of sampled ROIs ( values for all patients are reported in Table 1). The color code in the figure indicates the propagation step in which the corresponding CP is involved in ictal activity (i.e. Act. Step). Small grey dots mark the ROIs not included in the SEEG pattern. Finally, in order to enable comparison of the SEEG propagation pattern with the one modelled via the SI dynamics via the Mann-Whitney U test, we calculated the activation rank (Act. Rank) of each ROI, such that the ROIs were ordered and ranked according to the activation step, and groups with the same rank were assigned a rank equal to the midpoint of unadjusted values.

