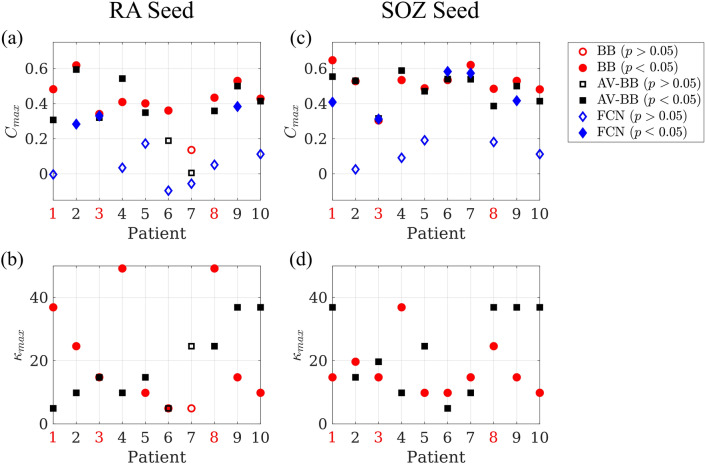
Figure 7.
Reproduction of seizure propagation patterns. Panels (a) and (c) show the average maximum correlation achieved by the individual BB networks (BB, red circles), and the average BB one (AV-BB, black squares), and the correlation found for the fully connected network (FCN, blue diamonds), respectively for the RA and SOZ seeds. Panels (b) and (d) show the corresponding for the individual (BB, red circles) and average (AV-BB, black squares) networks. Significant correlations () are indicated by a filled marker, and non-significant ones () by an empty marker. NSF patients are indicated by red labels.

