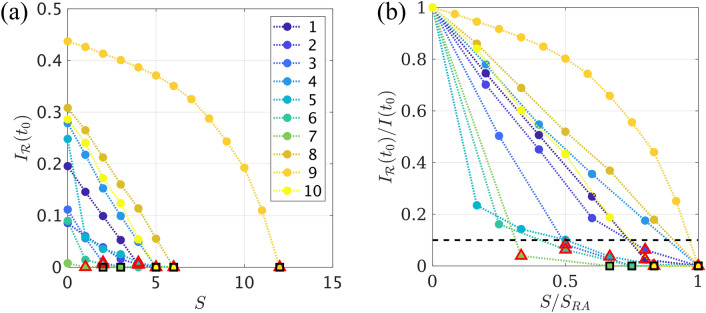
Figure 8.
Optimal Virtual Resection. (a) Reduction in epidemic spreading for virtual resections of increasing size S, as quantified by the decrease in . Each curve corresponds to one patient, as indicated in the legend. Red triangles mark the resection that achieved a 90% decrease in propagation, , and black squares the smallest resection that stopped seizure propagation, . (b) In order to enable comparison of the VRs performance between patients, we depict the normalized decrease in propagation, , as a function of the normalized resection size, . The black dashed line indicates a 90% decrease in propagation.

