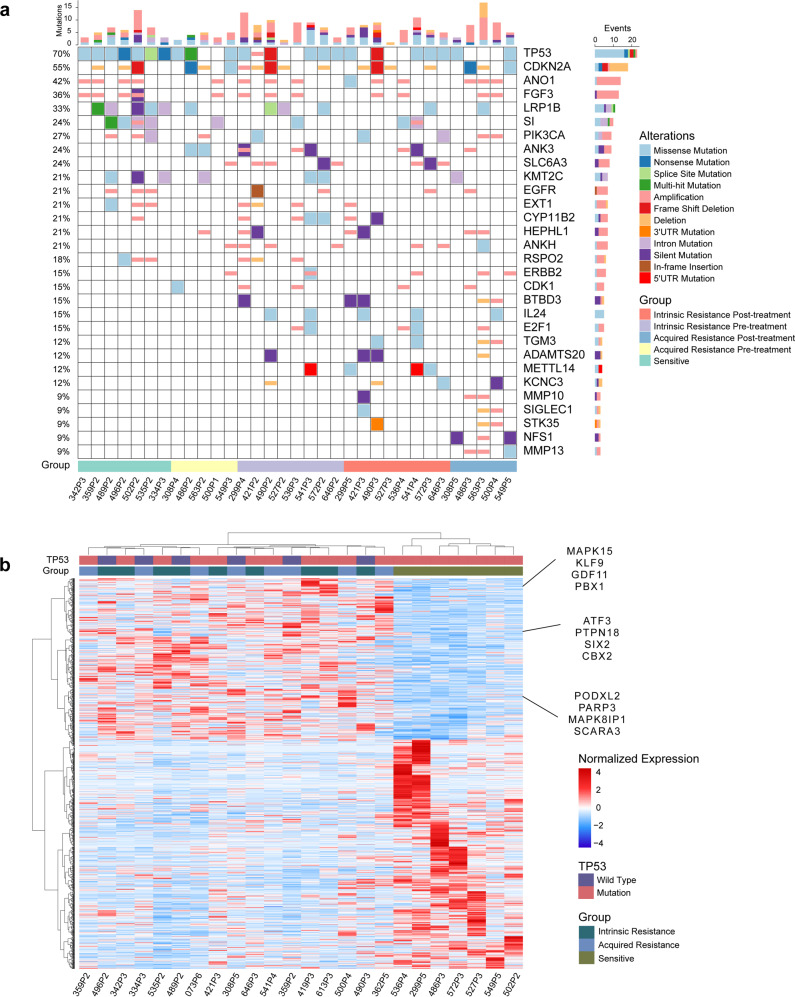
Fig. 2.
Genetic and transcriptomic landscape of HNSCC PCT. a Genetic matrix depicting the genomic landscape of the cetuximab PCT cohort. Copy number alterations and mutational events in select genes of interest are shown. Parameters (shown at the right) include alterations and groups. CNV, copy number variation; SNV, single-nucleotide variant. The x axis represents each sample ID and the y axis represents the frequency of CNVs and SNVs in the genes. The bar graph indicates the number of gene alterations in each sample. b Unsupervised hierarchical clustering heatmap showing the relative gene expression levels of the 2500 selected variable genes from an RNA-seq analysis of resistant and sensitive PDXs. Twelve genes of interest are labeled on the right side of the heatmap

