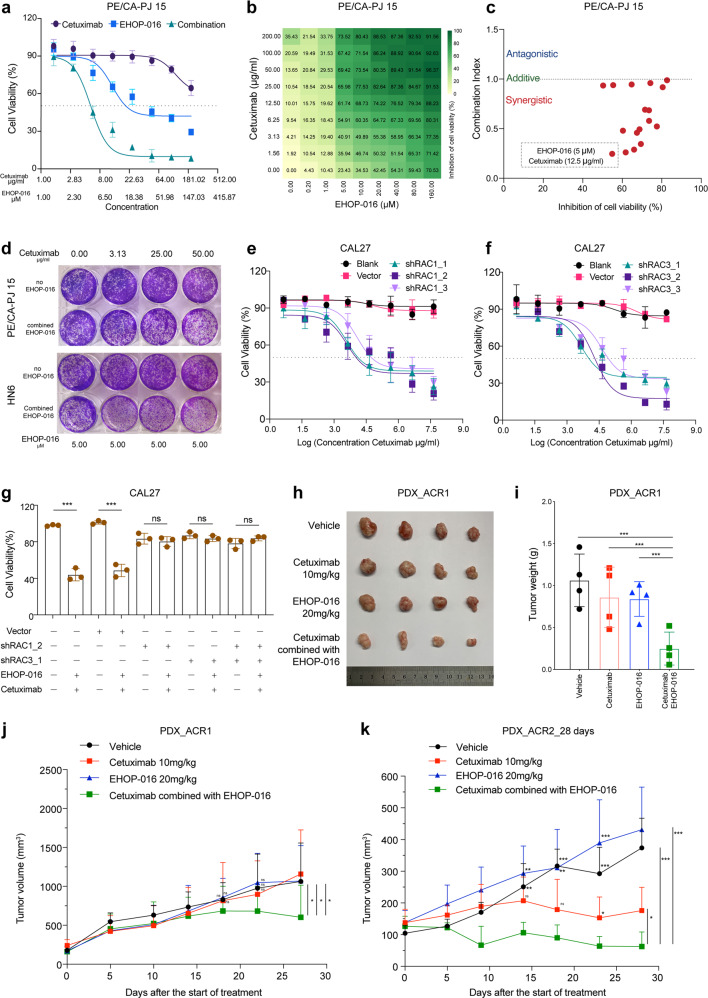
Fig. 7.
Therapeutic intervention of RAC1 and RAC3 by EHOP-016 to overcome resistance to cetuximab in HNSCCs. a Dose–response effects of cetuximab, EHOP-016 alone or in combination on the inhibition of cell viability in PE/CA-PJ 15 cells estimated after 3 days of drug treatment using CCK-8 assays. Each condition represents at least three biological replicates. b The 9 × 9 heatmaps for the combination of cetuximab with EHOP-016 in PE/CA-PJ 15 cells. c Combination index (CI) scores of EHOP-016 and cetuximab combination in PE/CA-PJ 15 cells, calculated at various effect levels (bottom). d Colony-formation assays performed with PE/CA-PJ 15 cells and HN6 cells, upon treatment with the RAC1/RAC3-inhibitor EHOP-016 alone, cetuximab alone, or a combination treatment comprising EHOP-016 and cetuximab at the indicated concentrations. e Cell viability was determined in CAL27 cells transfected with blank (no virus), RAC1 shRNA-expressing lentivirus (shRAC1_1, shRAC1_2, shRAC1_3) and empty vector lentivirus (vector) in the presence of dose gradients of cetuximab using a CCK8 assay. f Cell viability was determined in CAL27 cells transfected with blank (no virus), RAC3 shRNA-expressing lentivirus (shRAC3_1, shRAC3_2, shRAC3_3) and empty vector lentivirus (vector) in the presence of dose gradients of cetuximab using a CCK8 assay. g Cell viability was determined in CAL27 cells transfected with blank (no virus), RAC1 shRNA-expressing lentivirus (shRAC1_2), RAC3 shRNA-expressing lentivirus (shRAC3_1), and empty vector lentivirus (vector) with or without the combination treatment of EHOP-016 (5 µM) and cetuximab (12.5 µg/ml) using a CCK8 assay. h–k Three weeks after the start of treatment, tumor growth curves in the cetuximab-acquired resistance PDX model (PDX_ACR1, PDX_ACR2) treated with solvent control (vehicle), EHOP-016, and cetuximab, alone or in combination (as indicated). Tumor growth curves of PDX_ACR1 (j) and PDX_ACR2 (k). Photographs of tumors (h). Tumor weight of PDX_ACR1 (i). n = 4 mice for each group in PDX_ACR1, n = 5 mice for each group in PDX_ACR2. Mean tumor volumes ± SD are plotted. *P ≤ 0.05; **P ≤ 0.01; ***P ≤ 0.001

