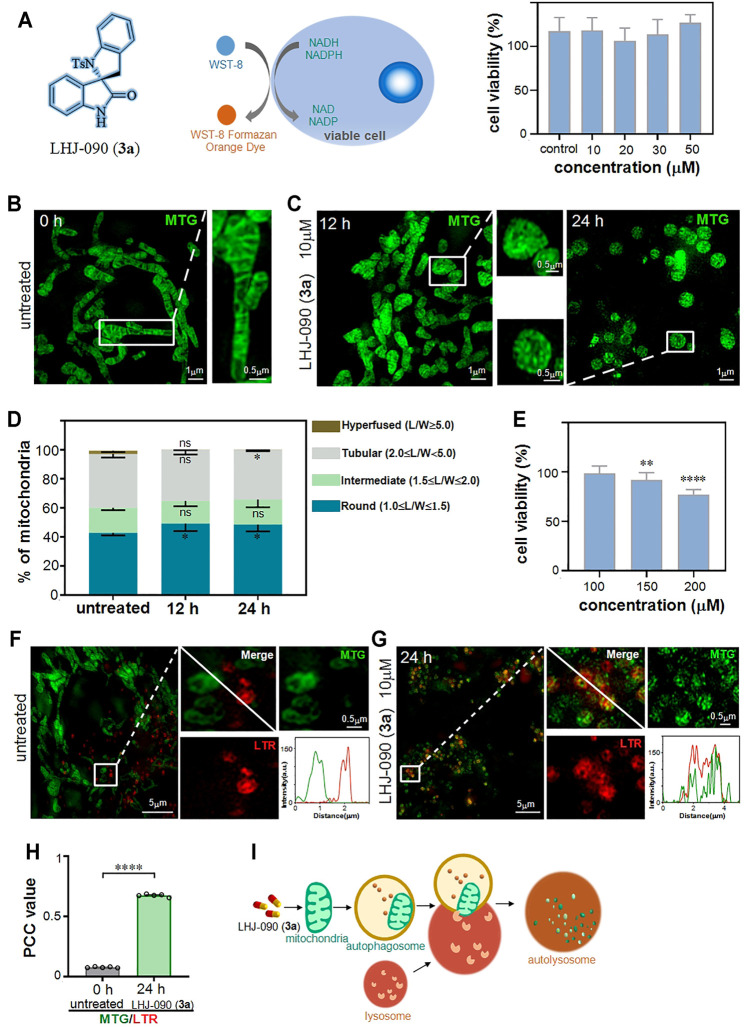
FIGURE 2.
LHJ-090 (3a) damage mitochondria and stimulate the process of mitophagy. (A) The cell viability (%) obtained with cck8 assay. Percentage of viable HeLa cells after treated with different concentrations of 3a (0 10, 20, 30 and 50 μM) for 24 h (B,C) SIM imaging of mitochondria in HeLa cells were treated with 3a (10 μM) for 0, 12, and 24 h and then stained with the mitochondrial tracker probe (mito-tracker-green, MTG) (λex = 488 nm) for 0.5 h. (D) Quantitative analyze of mitochondrial morphology in HeLa cells after treated with 3a for 0, 12, and 24 h. Data was appeared as Mean ± SEM (n = 5). *p < 0.05, all compared with untreated cells. (E) The cell viability (%) obtained with CCK-8 assay at high concentration 3a stimulation, more than 150 μM shows toxicity to cells. (F,G) SIM colocalization images of MTG-stained mitochondria and LTR-stained lysosome with (G) or without (F) 3a treatment, the white solid square indicates fluorescence intensity. (H) The PCC values for MTG and LTR in HeLa cells from (F) and (G). (I) A schematic diagram of the role of 3a in mitochondrial damage.

