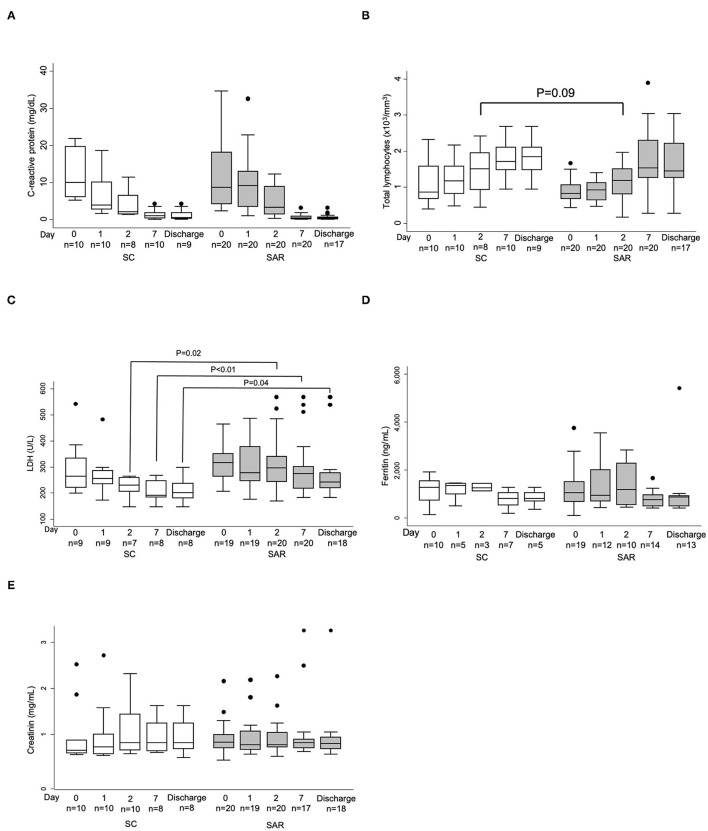
Figure 4.
Evolution of laboratory parameters throughout study visits. (A) C reactive Protein; (B) Total lymphocyte count; (C) Lactate dehydrogenase; (D) Ferritin; (E) Creatinin. Patients from standard care (SC; white boxes) and sarilumab (SAR; gray boxes). Only values available at each time point is shown and results are displayed as the interquartile range (p75 upper edge of the box, p25 lower edge, p50 midline) as well as the p95 (line above box) and p5 (line below). Dots represent outliers.

