Figure 2.

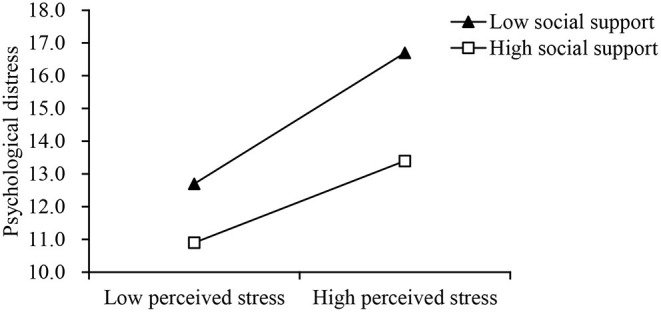
Interaction between perceived stress (x-axis) and low (−1 SD) and high (+1 SD) levels of social support on psychological distress (y-axis).

Interaction between perceived stress (x-axis) and low (−1 SD) and high (+1 SD) levels of social support on psychological distress (y-axis).