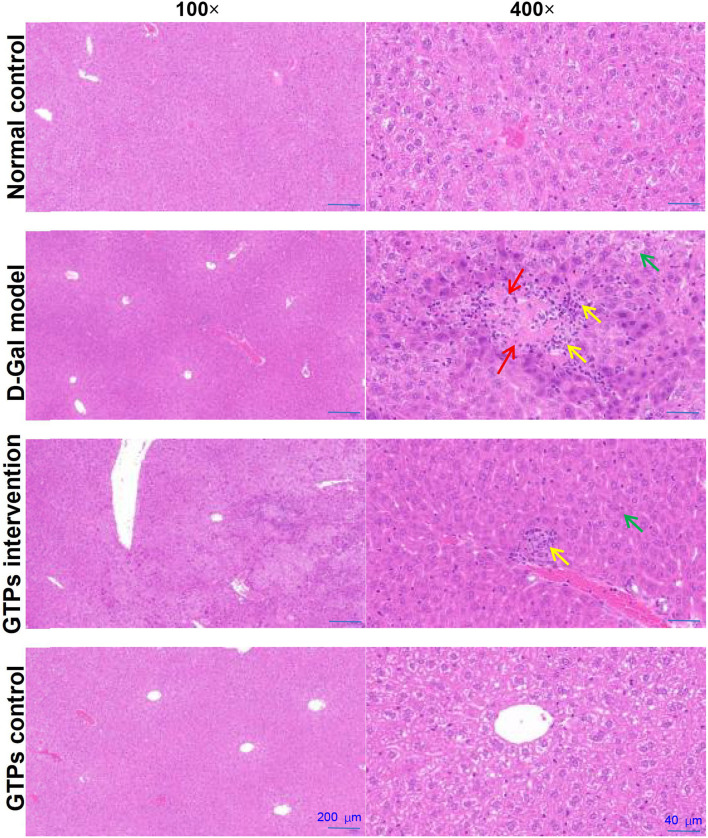
Figure 3.
Effects of GTPs on hepatic histopathological alterations in D-Gal-treated mice. Representative HE-stained sections of the liver tissues from rats in each group (100× and 400×). Green arrow indicates edema, vacuoles, and cytoplasmic porosity. Yellow arrow indicates inflammatory cell infiltration. Red arrow indicates degeneration. Scale bars (200 and 40 μm).

