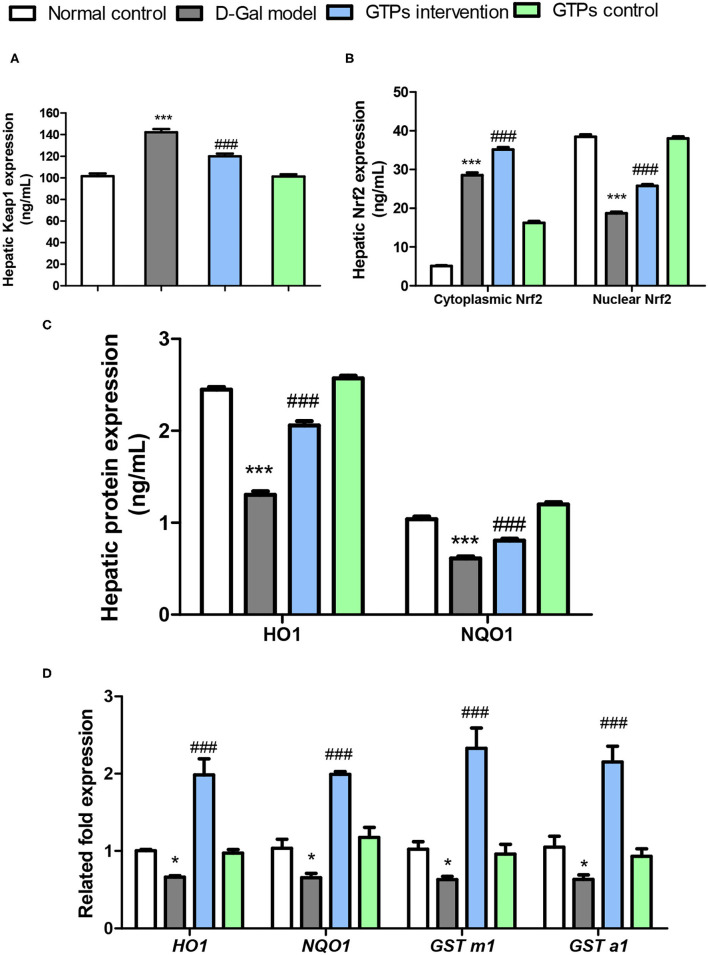
Figure 4.
Effects of GTPs on the expressions of Nrf2 pathway in the liver of D-Gal-treated mice. (A) Hepatic protein levels of Keap1. (B) Hepatic protein levels of cytoplasmic and nuclear Nrf2. (C) Hepatic protein levels of HO1 and NQO1. (D) Hepatic mRNA expressions of Nrf2-targeted genes. ***P < 0.001 vs. control group; ###P < 0.001 vs. the D-Gal model group.

