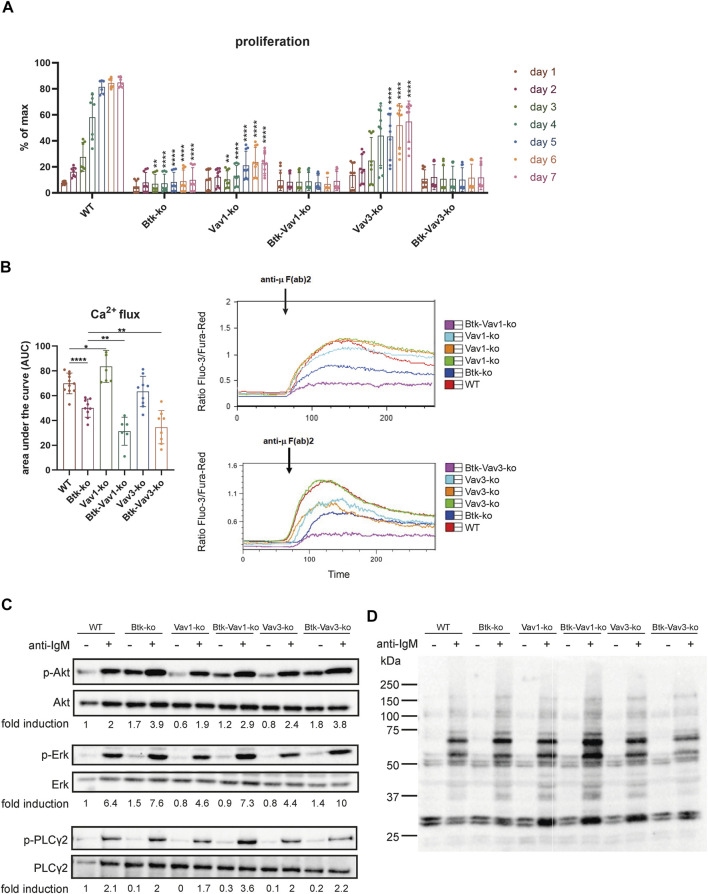
FIGURE 5.
Vav-protein deficiency affects B cell proliferation and exacerbates Ca2+ mobilization defects. (A) Statistical analysis of flow cytometry data showing CFSE dilution of B cells. Splenocytes were labeled with CFSE and proliferation of B220+ B cells was monitored over 7 days. Asterisks indicate significances compared to WT control animals. (B) Statistics of Ca2+ influx showing the area under the curve upon anti-µ F (ab) 2 stimulation (left). Representative plots depicting Ca2+ influx over time after anti-µ F (ab) 2 stimulation are shown (right). Each point represents data from a single mouse. Data in the graphs are shown as means ± SD (n = at least 6 mice per group). Data are merged from three independent experiments. *p < 0.05, **p < 0.01, ***p < 0.001, and **** < p 0.0001. p-values were determined using a two-tailed Student’s t test or Mann-Whitney-U test. (C) Naïve B cells were isolated from respective mouse strains and stimulated with anti-µ F (ab) 2 for 3 min. Cells were lysed and phosphorylated forms of Akt (S473), Erk (Y204) and PLCγ2 (Y1217) as well as phospho-tyrosine were assessed by western blot. Non-phosphorylated proteins were used as loading controls. Representative image of 2 independent experiments. Mice were analyzed in an age range from 7–14 weeks

