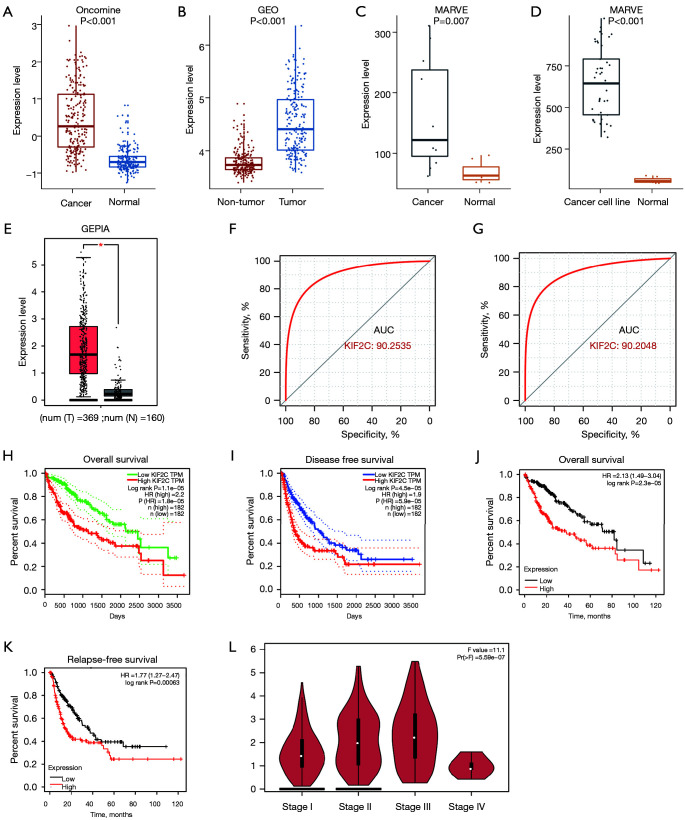
Figure 2.
Clinical analysis and expression of KIF2C in HCC based on database. (A-E) Level of KIF2C expression in Oncomine, GEO, MERAV tissue, MERAV HCC cell line, and GEPIA datasets, respectively. (F,G) Diagnostic receiver-operating characteristic curves for KIF2C in GEO and Oncomine datasets. (H,I) Survival curves in GEPIA. (J,K) Survival curves in Kaplan-Meier Plotter website. (L) Relationship between KIF2C and HCC stage from GEPIA. *, P<0.05. KIF2C, kinesin family member 2C; HCC, hepatocellular carcinoma; GEO, Gene Expression Omnibus; MERAV, Metabolic gEne RApid Visualizer; GEPIA, Gene Expression Profiling Interactive Analysis; AUC, area under the curve; TPM, transcripts per million; HR, hazard ratio.

