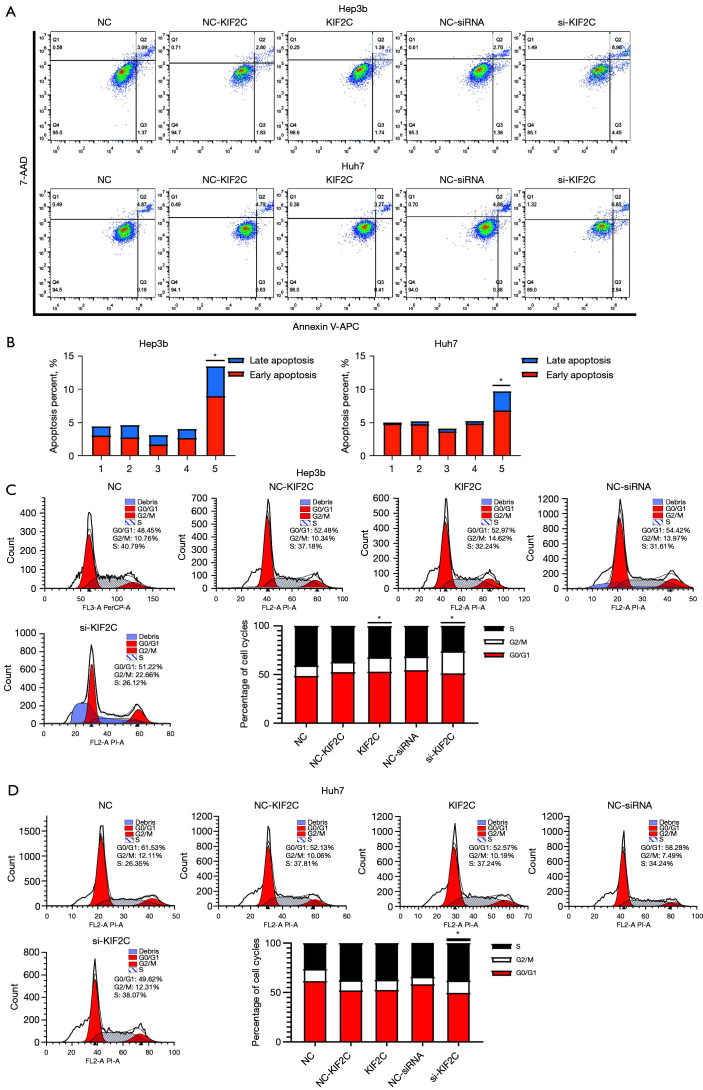
Figure 5.
Results of cell cycle and apoptosis assay. (A,B) Number of apoptotic cells in each group and cell line detected by flow cytometry assay and statistical analysis. (C,D) Cell cycle distribution in each group calculated by flow cytometry assay and statistical analysis in Hep3b and Huh7 cell lines, respectively. *, P<0.05. KIF2C, kinesin family member 2C; NC, negative control; shRNA, short hairpin RNA.

