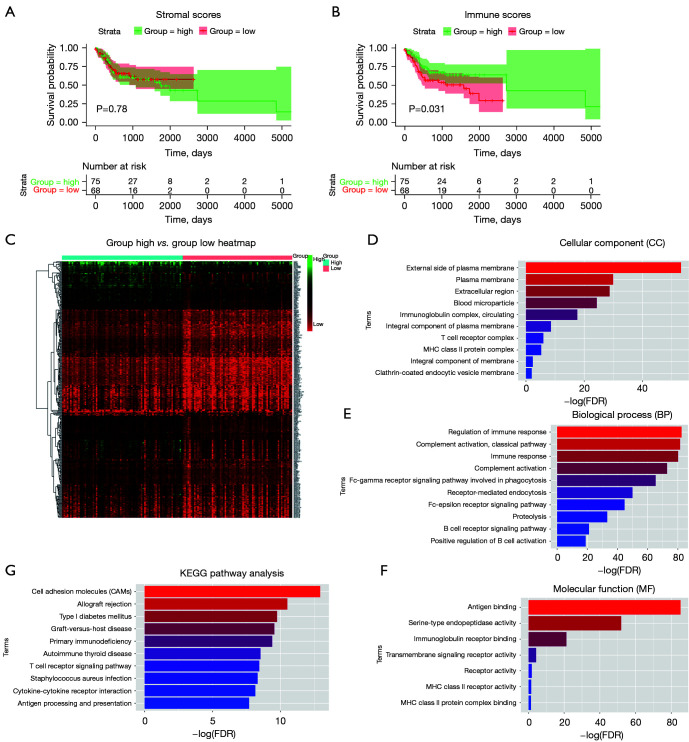
Figure 1.
Stromal scores and immune scores were associated with OS in OSCC, and the profile of the DEGs was identified from the immune score groups. (A) Kaplan-Meier curves of the high and low groups based on their stromal scores with OS time. (B) Kaplan-Meier curves of the high and low groups based on their immune scores with OS time. (C) Heatmap of the DEGs between the high and low immune scores, P<0.05. (D-F) GO analysis of the DEGs in the two groups based on immune score, including CCs, BPs, and MFs. (G) KEGG pathway enrichment analysis of the DEGs. OS, overall survival; OSCC, oral squamous cell carcinoma; DEGs, differentially expressed genes; GO, Gene Ontology; CCs, cellular components; BPs, biological processes; MFs, molecular functions; KEGG, Kyoto Encyclopedia of Genes and Genomes; MHC, major histocompatibility complex; FDR, false discovery rate.

