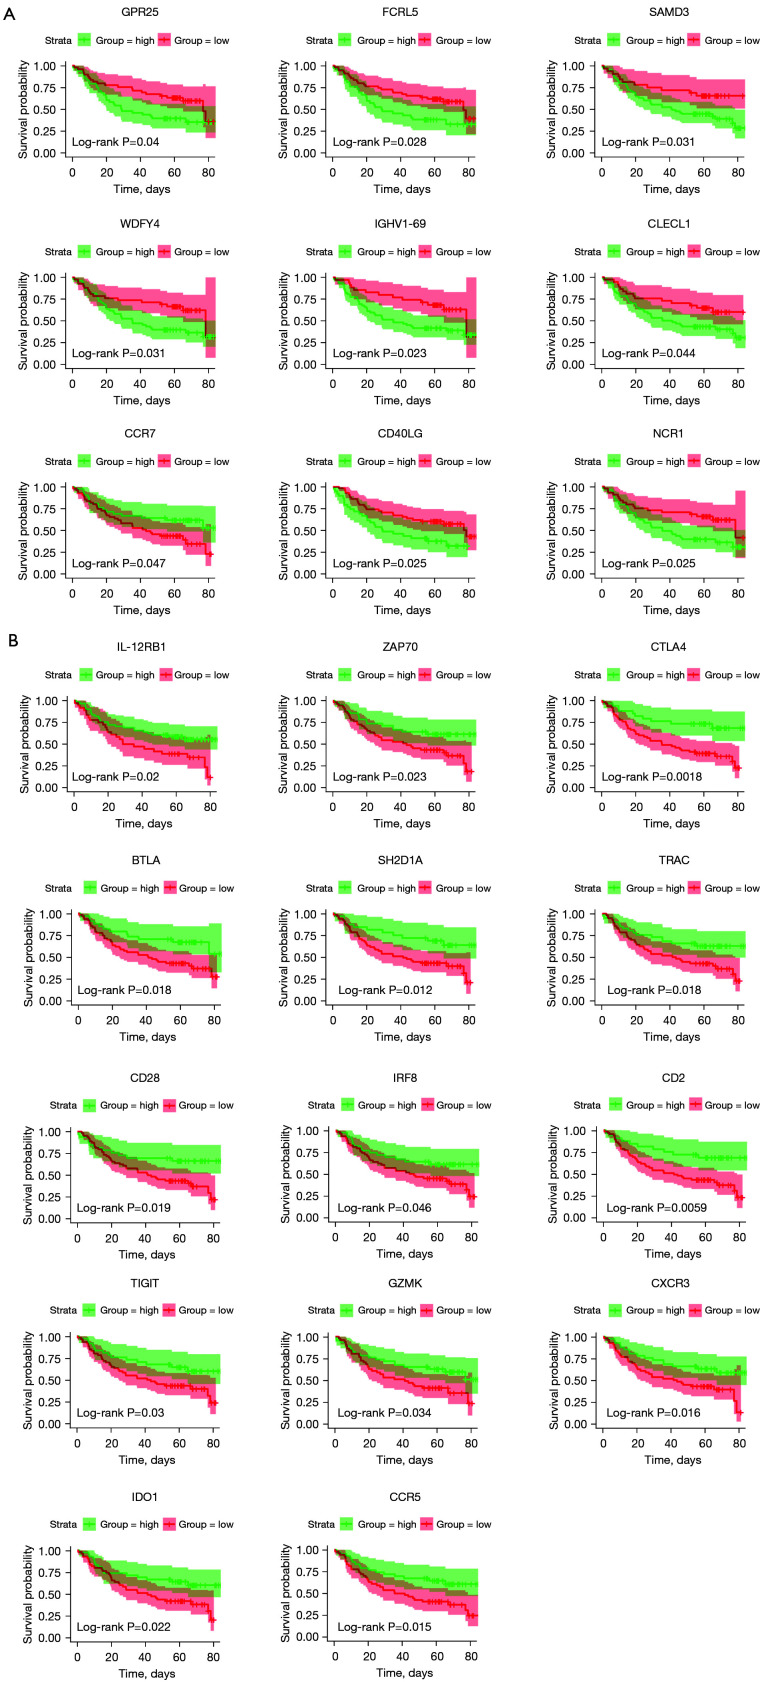
Figure 2.
Validation of the prognostic genes extracted from the TCGA database with OS in GSE41613. Kaplan-Meier survival curves were used to select the DEGs though the comparison of high (green line) and low (red line) groups of gene expression. (A) Nine low expression genes such as GPR25 and FCRL5 etc. were shown to predict better 5-year OS. (B) Fourteen high expression genes such as IL-12RB1 and CTLA4 etc. were shown to predict better 5-year OS. P<0.05 in log-rank test. TCGA, The Cancer Genome Atlas; OS, overall survival; DEGs, differentially expressed genes; GPR25, G protein-coupled receptor 25; FCRL5, Fc receptor like 5; IL-12RB1, interleukin 12 receptor subunit beta 1; CTLA4, cytotoxic T-lymphocyte associated protein 4; SMAD3, SMAD family member 3; WDFY4, WDFY family member 4; IGHV1-69, immunoglobulin heavy variable 1-69; CLECL1, C-type lectin like 1; CCR7, C-C motif chemokine receptor 7; CD40LG, CD40 antigen ligand; NCR1, natural cytotoxicity triggering receptor 1; ZAP70, zeta chain of T cell receptor associated protein kinase 70; BTLA, B and T lymphocyte associated; SH2D1A, SH2 domain containing 1A; TRAC, T cell receptor alpha constant; IRF8, interferon regulatory factor 8; TIGIT, T cell immunoreceptor with Ig and ITIM domains; GZMK, granzyme K; CXCR3, C-X-C motif chemokine receptor 3; IDO1, indoleamine 2,3-dioxygenase 1; CCR5, C-C motif chemokine receptor 5.

