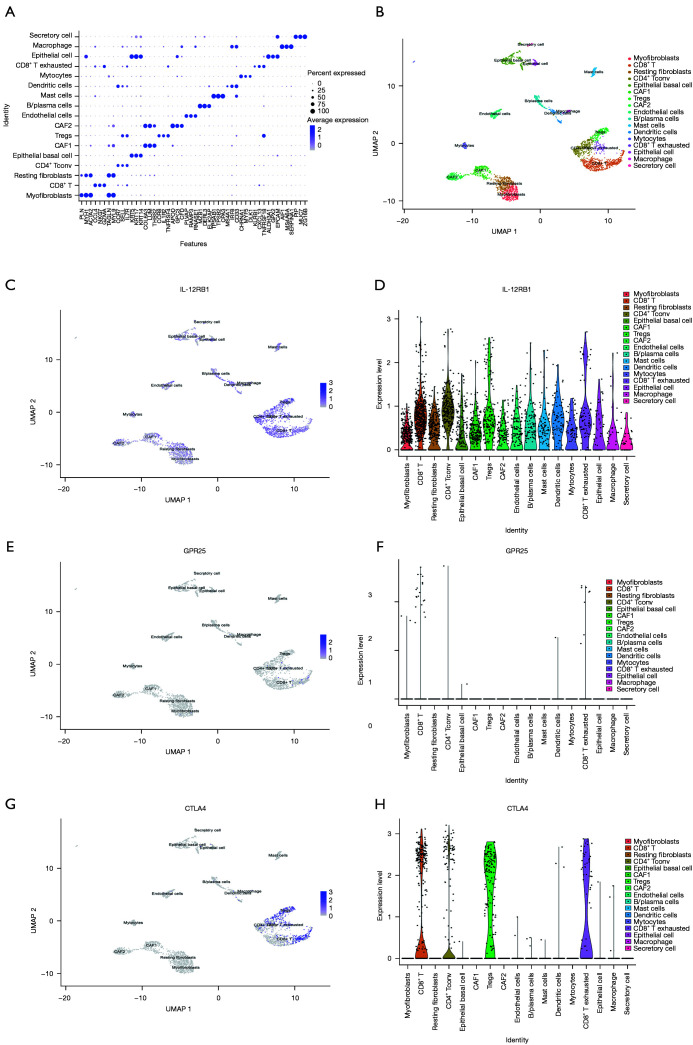
Figure 4.
The expression pattern of IL-12RB1, GPR25, and CTLA4 in malignant and non-malignant cells from the single-cell RNA sequence dataset of GSE103322. (A) Dot plot showing the top 3 marker genes of indicated clusters cells. (B) UMAP projection of the OSCC cells colored by clusters, which were annotated based on the expression of known marker genes. (C) UMAP plot showing the expression level of IL-12RB1 among clusters. (D) Violin plot showing the expression level of IL-12RB1 in distinct clusters. (E) UMAP plot showing the expression level of GPR25 in distinct clusters. (F) Violin plot showing the expression level of GPR25 among clusters. (G) UMAP plot showing the expression level of CTLA4 in distinct clusters. (H) Violin plot showing the expression level of CTLA4 among clusters. IL-12RB1, interleukin 12 receptor subunit beta 1; GPR25, G protein-coupled receptor 25; CTLA4, cytotoxic T-lymphocyte associated protein 4; UMAP, Uniform Manifold Approximation and Projection for Dimension Reduction; OSCC, oral squamous cell carcinoma; CAF1, cancer associated fibroblast 1; CAF2, cancer associated fibroblast 2.

