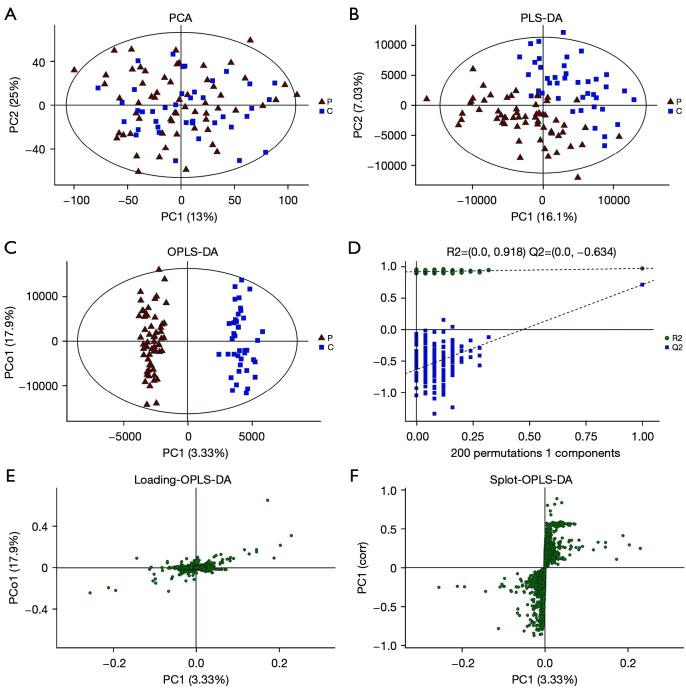
Figure 4.
There are significant differences in plasma metabolomics between the patient group and the control group. (A) The ellipse area of the PCA in the patient group and the control group represents the 95% confidence interval. (B) PLS-DA diagram of the patient group and the control group. (C) OPLS-DA diagram of the patient group and the control group. (D) Permutation diagram of the patient group and the control group. (E) Loading diagram of the patient group and the control group. (F) Splot plot of the patient group and the control group. PCA, principal component analysis; PLS-DA, partial least squares-discriminant analysis; OPLS-DA, orthogonal partial least squares-discriminant analysis; PC, principal component; P, patient group samples; C, control group samples.

