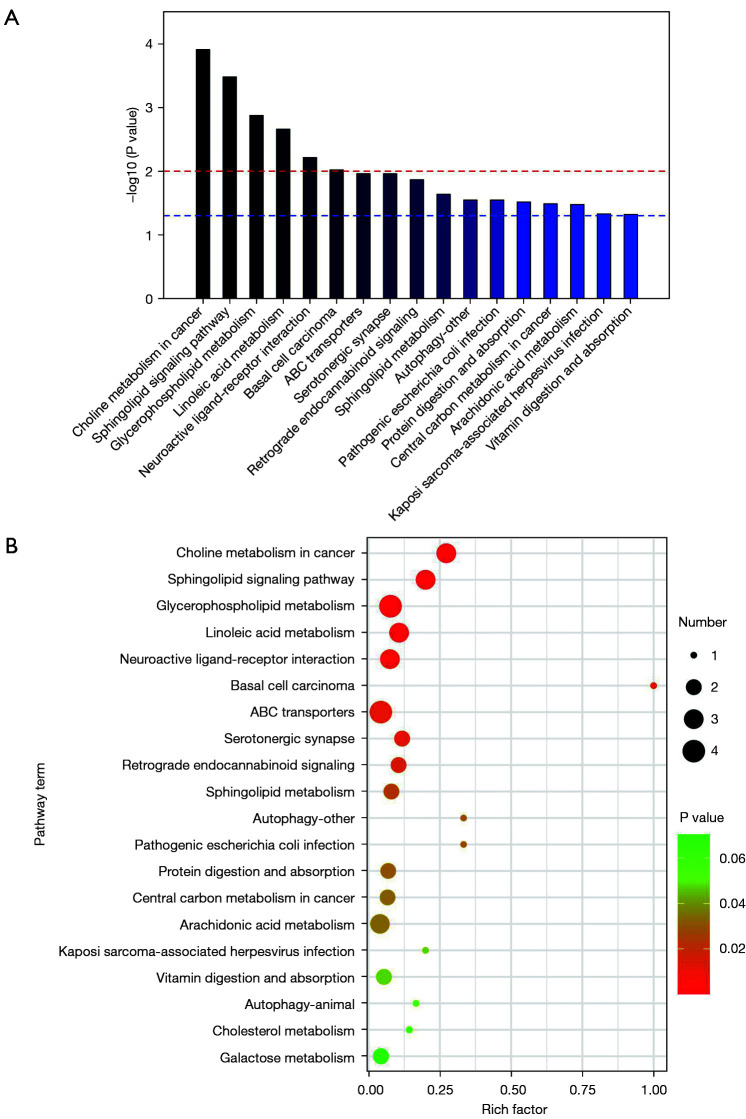
Figure 6.
Enrichment of differential metabolite metabolic pathways. (A) Top 20 metabolic pathway enrichment map. The P value in a metabolic pathway indicates the significance of the metabolic pathway enrichment. The P value indicated by the red line is 0.01, and that indicated by the blue line is 0.05. When the top of the column was higher than that of the blue line, the signal pathway represented by the red line was significant. (B) Top 20 bubble chart. The P value of metabolic pathway indicates the significance of enrichment. The ordinate is the name of the metabolic pathway. The abscissa is the enrichment factor (rich factor = the number of significant difference metabolites/the total number of metabolites in the pathway). The larger the rich factor, the greater the enrichment degree. The color from green to red indicates that the P value decreases in turn. The larger the dot, the more metabolites enriched on the pathway.

