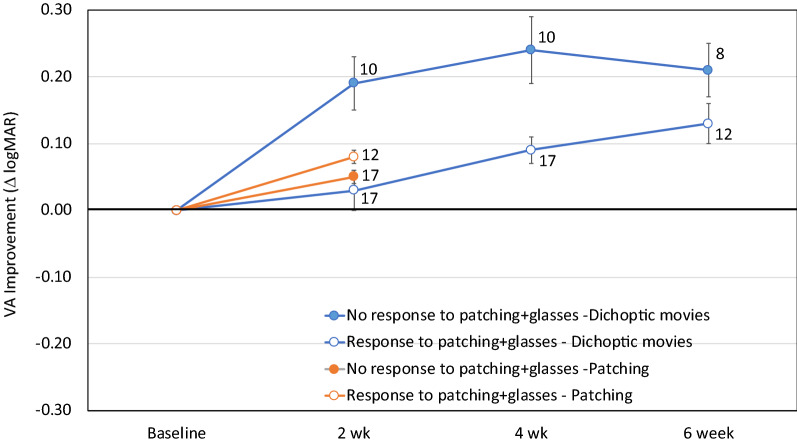
Figure 3.
Visual acuity improvement in the movie and patching groups in children who had a clinical history of prior visual acuity improvement when treated with glasses and patching and children who had no visual acuity improvement when treated with glasses and patching. Numbers to the right of each data point indicate the n at each timepoint for each subgroup. Note that 3 children in the movie group and 1 child in the patching group were too young to provide visual acuity data on two visits prior to the enrollment visit and, as a result, could not be categorized as no response or response. These children were excluded from this analysis.

