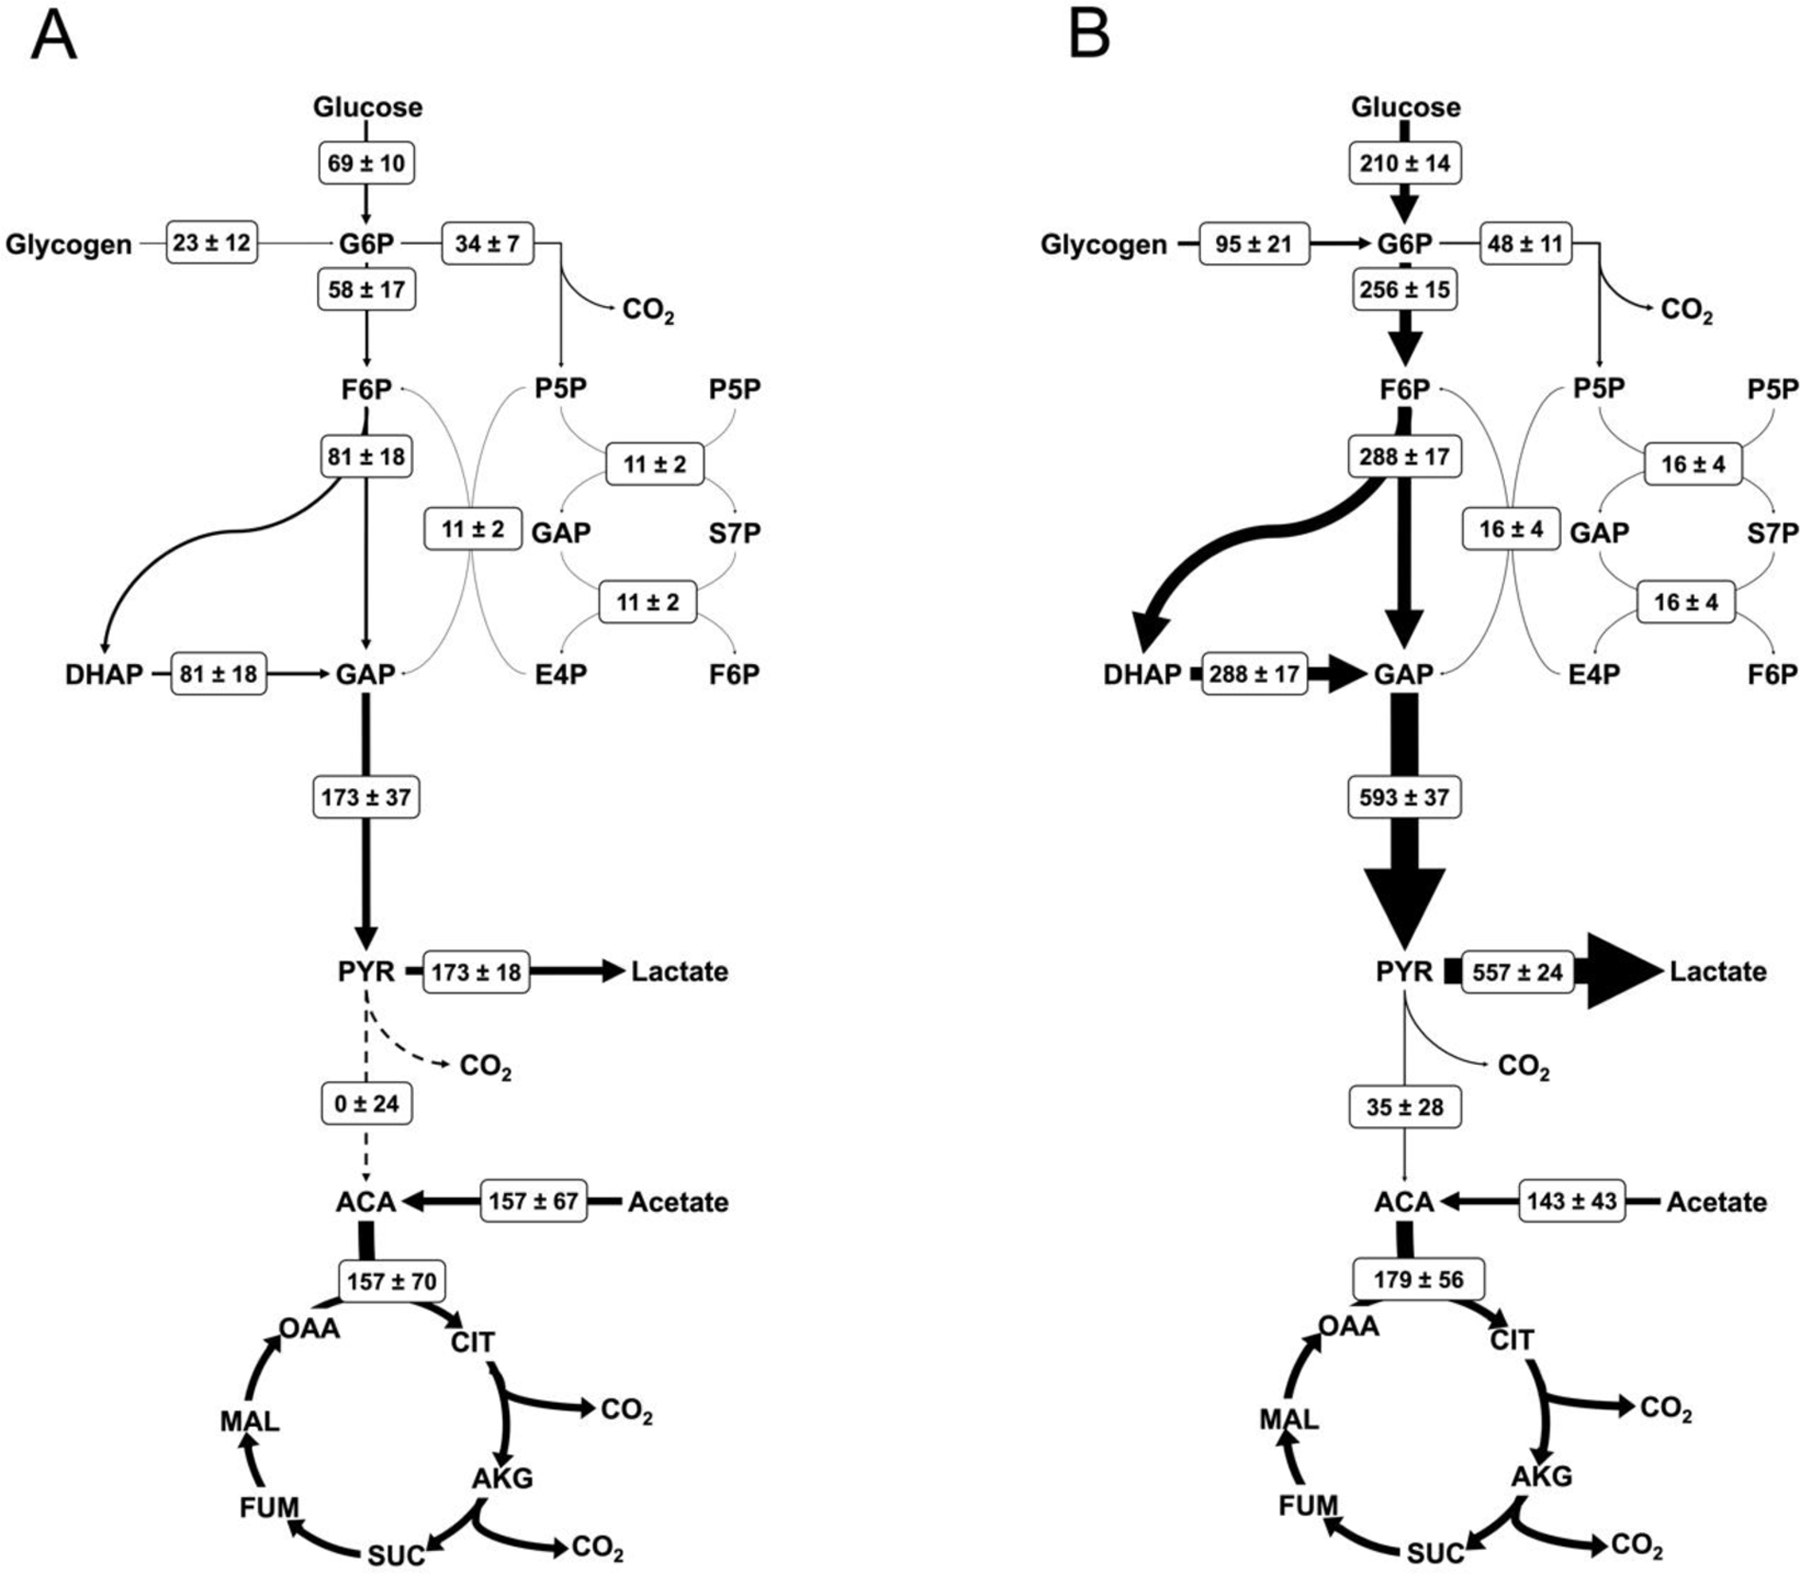
Figure 6. Flux maps of platelet metabolism.

Net fluxes are shown for (A) resting and (B) thrombin activated conditions in the form M±SE where M is the calculated flux and SE is the standard error of the 95% confidence interval between upper and lower bounds with units of nmol/1010 platelets/min. Arrow thickness is linearly proportional to the net flux, with dashed lines representing zero net flux. All calculated net fluxes and their 95% confidence interval are listed in Supplemental Table 1.
