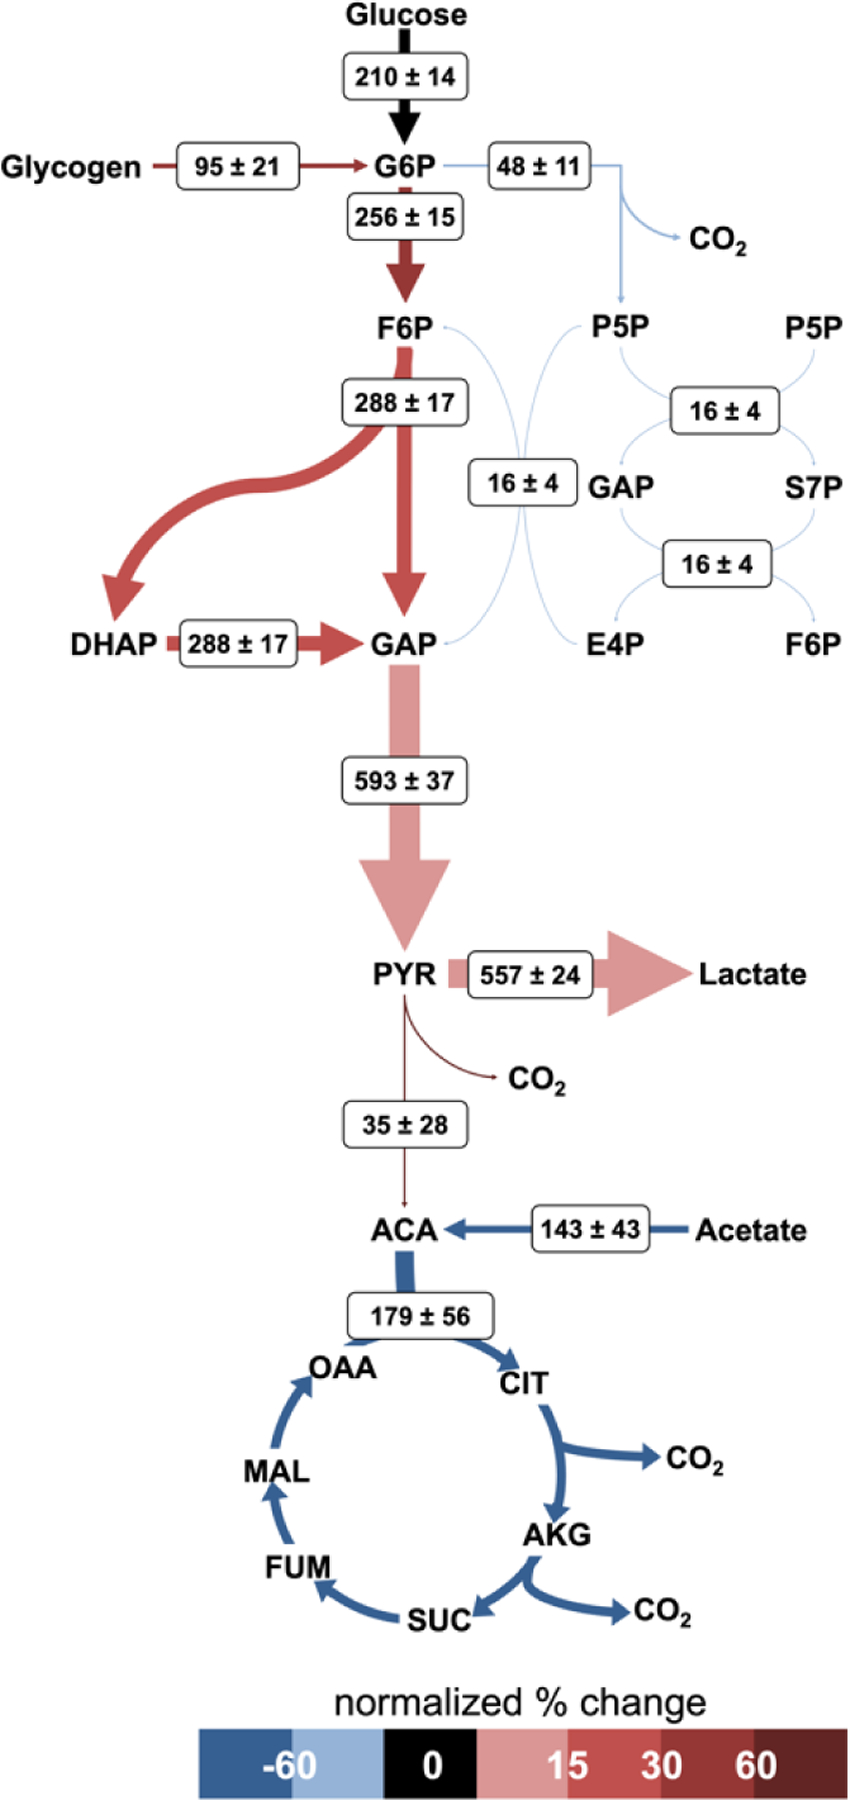
Figure 7. Normalized fluxes of activated platelet metabolism.

Net fluxes and arrow thicknesses are shown as previously described for Fig 6. Arrow color represents the percent change of the thrombin condition normalized flux from the resting condition normalized flux. Fluxes are normalized to the total glucose uptake rate. [please use color for figure in print]
