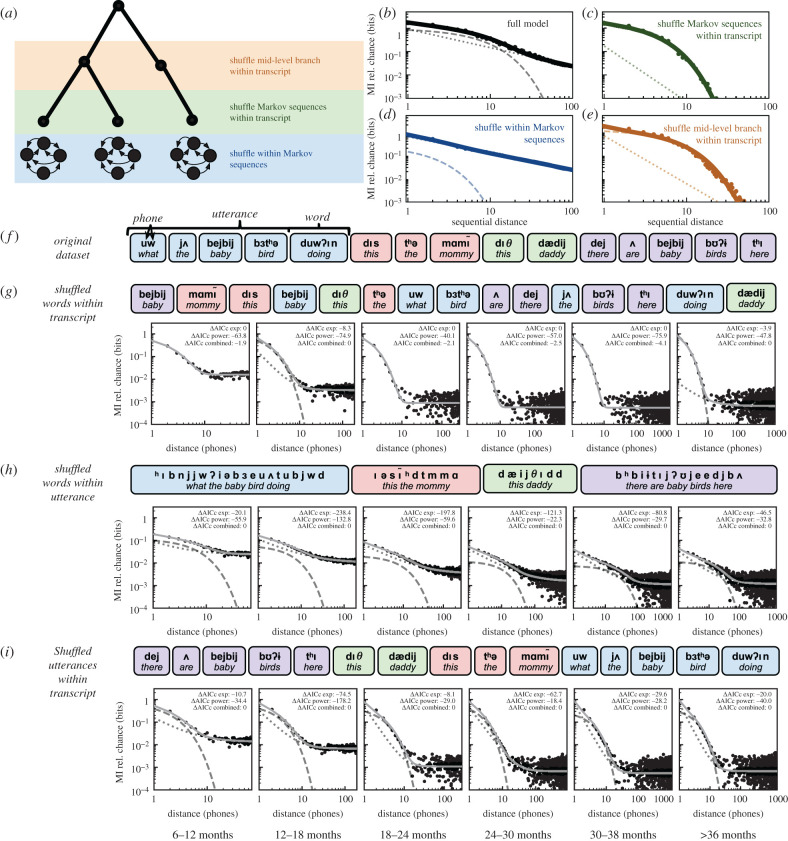
Figure 4.
MI decay between phones under different shuffling conditions. (a) An example PFSG model with endpoints generated from Markov models as in [2]. Shuffling controls are given at three levels of organization in the model: within Markov-generated sequences (bottom/blue), between Markov-generated sequences (middle/green) and at a mid-level branch in the generated hierarchy (top/orange). (b) The MI decay curve for the model from (a). (c) The MI decay curve for the shuffle Markov sequences condition from (a). (d) The MI decay curve for the shuffle within Markov sequences condition from (a). (e) The MI decay curve for the shuffle within mid-level branch condition from (a). (f) An example sequence of utterances from the PhonBank dataset. Utterances are grouped by colour, words are grouped by rounded rectangles, and phones are displayed in bold above orthographic transcriptions. (g) MI decay, as in figure 3 when words are shuffled within each transcript. ΔAICc values (relative to best fit model) are shown for each fit model in each panel. (h) MI decay when phones are shuffled within each utterance. (i) MI decay when utterances are shuffled within each transcript. For each panel, as in figure 3a,d, the dashed and dotted lines represent the exponential and power-law components of the fit composite decay, respectively. When the best-fit model is not the combined model, a solid line is shown for the model fit without the dashed or dotted components.

