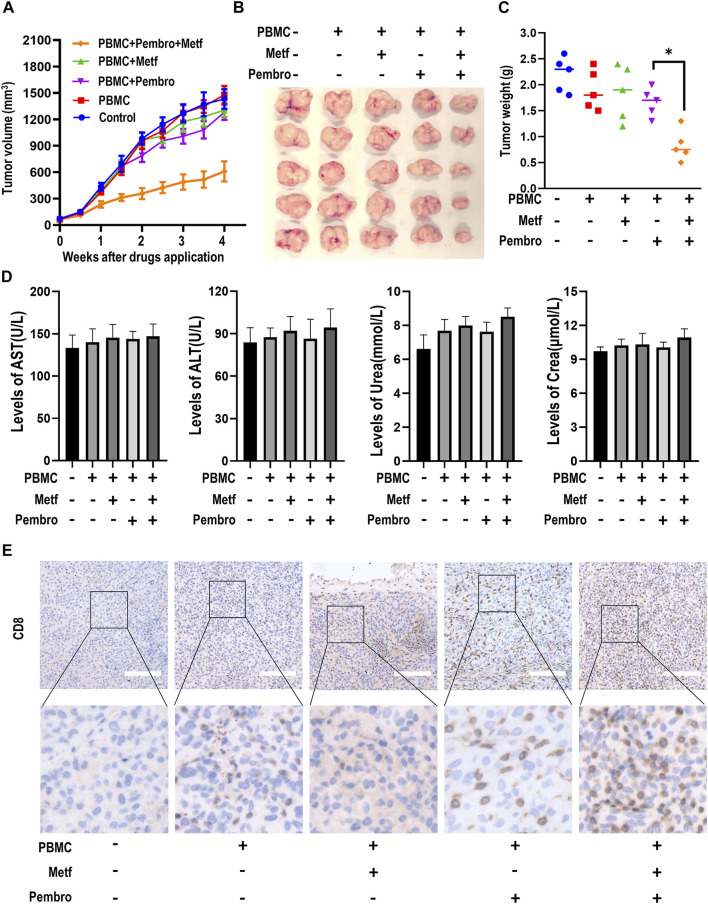
FIGURE 2.
Metformin enhanced the efficacy of PD-1 inhibitor in PBMCs-CDX mouse model. (A), Tumor growth curve of H460-derived xenograft mouse models treated as indicated. Tumor volume was shown as mean ± SEM (n = 5). *, p < 0.01 compared with the pembrolizumab group. (B), Macroscopic appearance of tumors after drug application for 4 weeks (C), Tumor weight (g) of each mouse was shown. *, p < 0.01. (D), The levels of serum AST, ALT, Urea and Creatinine in mice serum were presented as mean ± SEM (n = 5). (E), Immunohistochemistry analysis of CD8 in tumor sections from different groups. Representative images were shown. Scale bars: 200 μm. AST, Aspartate aminotransferase; ALT, Alanine aminotransferase; Crea, Creatinine.

