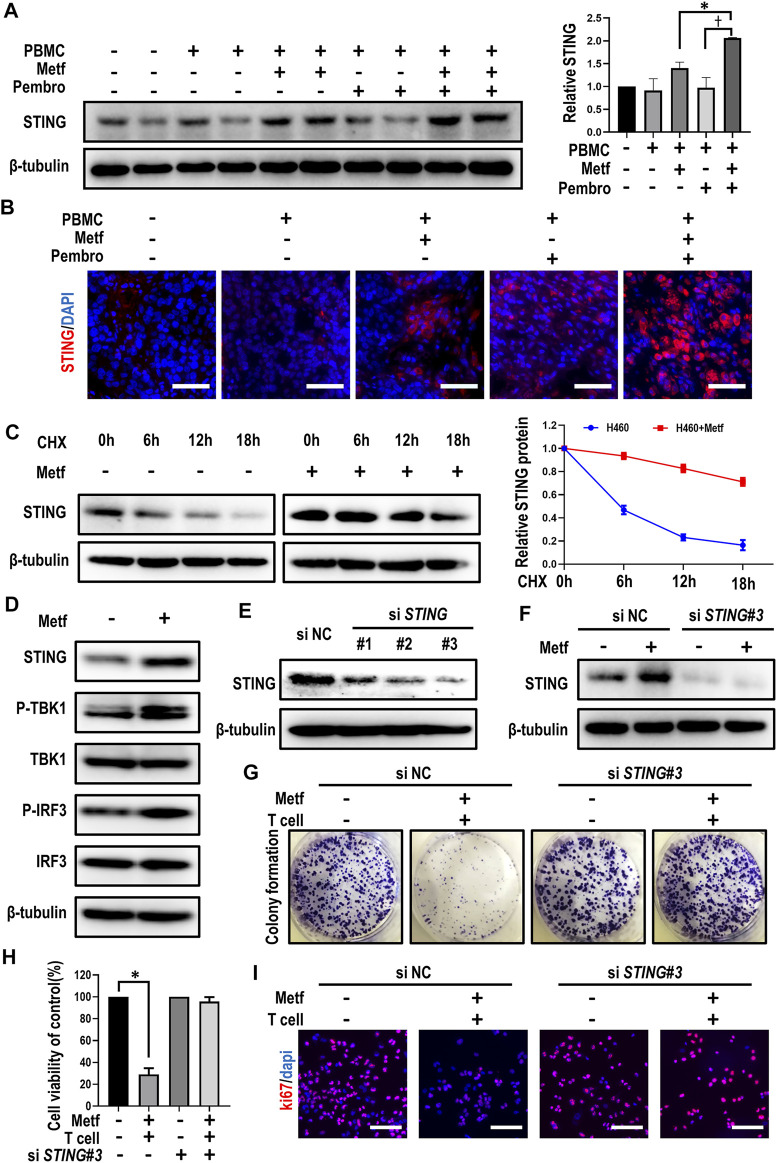
FIGURE 3.
Metformin enhanced T cell-mediated killing through stabilization of STING. (A), Western blot analysis of STING from tumor sections of each group and expression levels were presented. *p < 0.05; † p < 0.01. (B), Immunofluorescence staining of STING from tumor sections of different groups as indicated. Scale bars: 30 μm. (C), H460 cells were treated with 10 μM CHX at indicated intervals in the presence of metformin or not, and the level of STING was quantified using ImageJ software. (D), Western blot analysis of indicated proteins in H460 cells with metformin treatment. (E), Western blot showing the expression levels of STING in H460 cells after transfection with control or STING siRNAs, respectively. (F), Western blot analysis of STING expression under metformin treatment after siRNA-mediated knockdown of STING. (G), H460 cells transfected with control or STING siRNAs were co-cultured with activated T cells (cancer cells to T cells ratio, 1:1) for 48 h with or without metformin and then subjected to crystal violet staining. (H), Cell viability CCK-8 assay for cells treated as indicated. Data are shown as mean ± SEM of triplicate determinations. *p < 0.01. (I), Ki67 incorporation assay on H460 cells treated as indicated. Cells were counterstained with DAPI.

