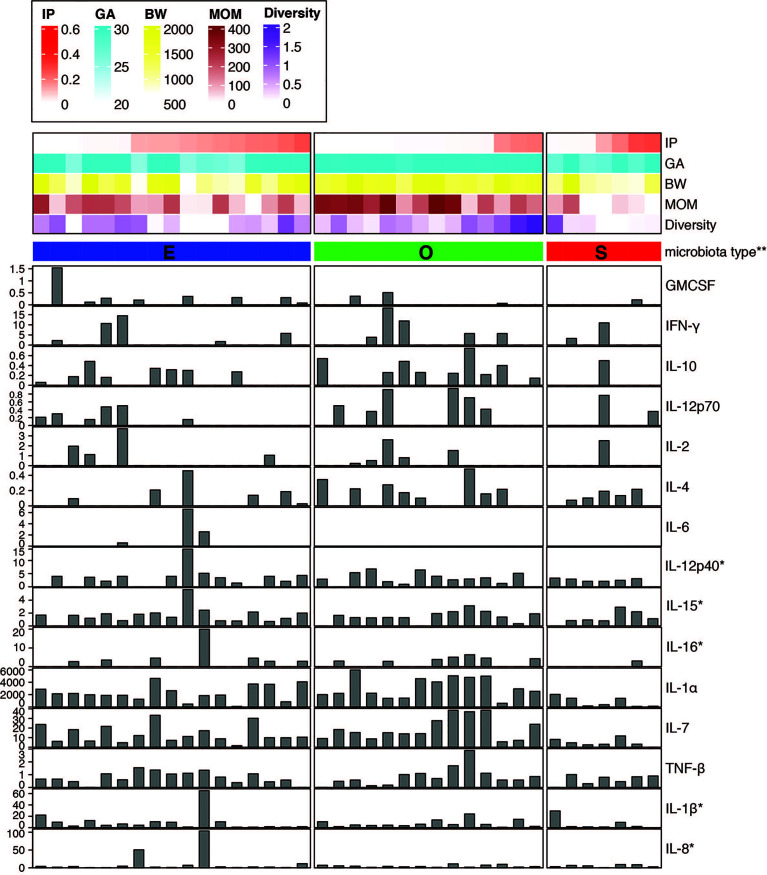
Figure 2.
Fecal cytokine profile associated with microbial diversity. Color map of microbial communities correlating with neonatal factors and barplot map of the 15 cytokines detected. Within-sample diversity was estimated using Shannon diversity index using Phyloseq R package (46). Plot was generated using R package ‘complexheatmap’ (47). *Value was scaled using square root. **Microbiota type was assigned according to the clustering pattern as shown in Figure 1 . IP, intestinal permeability; GA, gestational age; BW, birth weight; MOM, mother’s own breast milk cumulative volume use during the first week prior to IP measurement.

