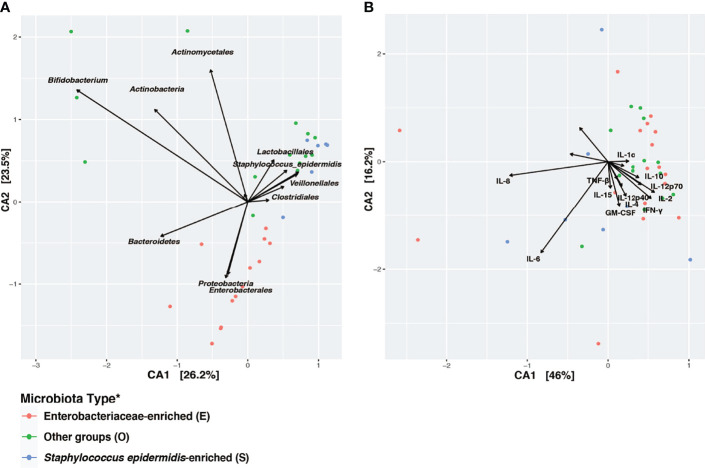
Figure 4.
Disparity in clustering patterns of taxonomic and immunological profiling among different microbiota types. Canonical Correspondence Analysis (CCA) of (A) microbial taxonomic groups; (B) cytokine profiles. CCA was based on Bray-Curtis distance. CA1 and CA2 selected as the major components based on the eigenvalue. A scaled eigenvalues was shown on the plot to represent the direction from the origin where a group has a larger than average value for the particular profile (42, 51). *Microbiota type was assigned according to the clustering pattern demonstrated in Figure 1 .

