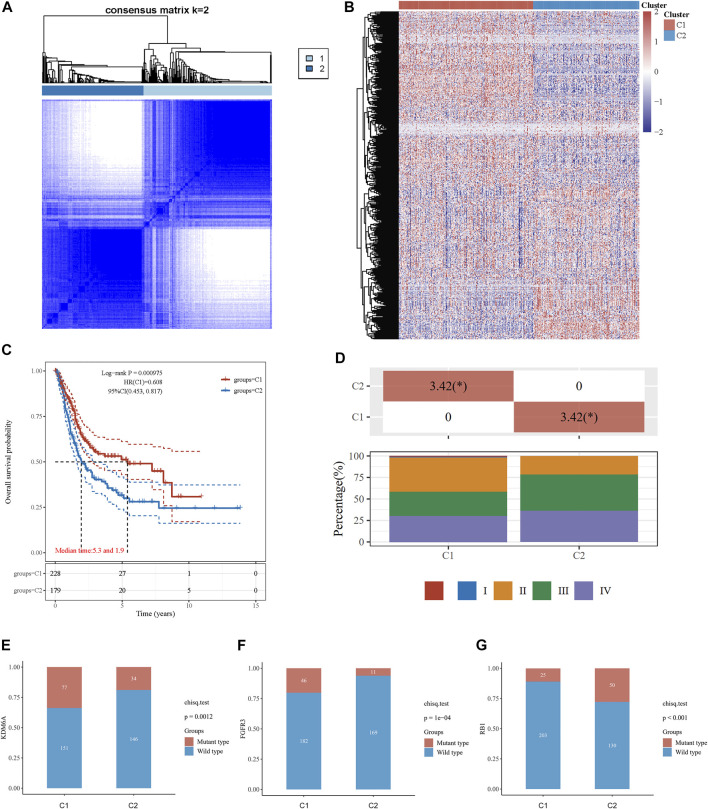
FIGURE 1.
Consensus clustering analysis to identify the genomic subtype of BLCA based on an energy metabolism-related gene set. (A) Consensus clustering matrix of 408 samples from the TCGA dataset for k = 2. (B) Heatmap of energy metabolism-related gene expression in different clusters. Red represents high gene expression, and blue represents low expression. (C) The Kaplan–Meier curve of overall survival of BLCA patients in two clusters. (D) Tumor stage distribution of BLCA patients in two clusters with different metabolic statuses. The frequency of KDM6A (E), FGFR3 (F), and RB1 (G) mutations in two clusters with different metabolic statuses.

