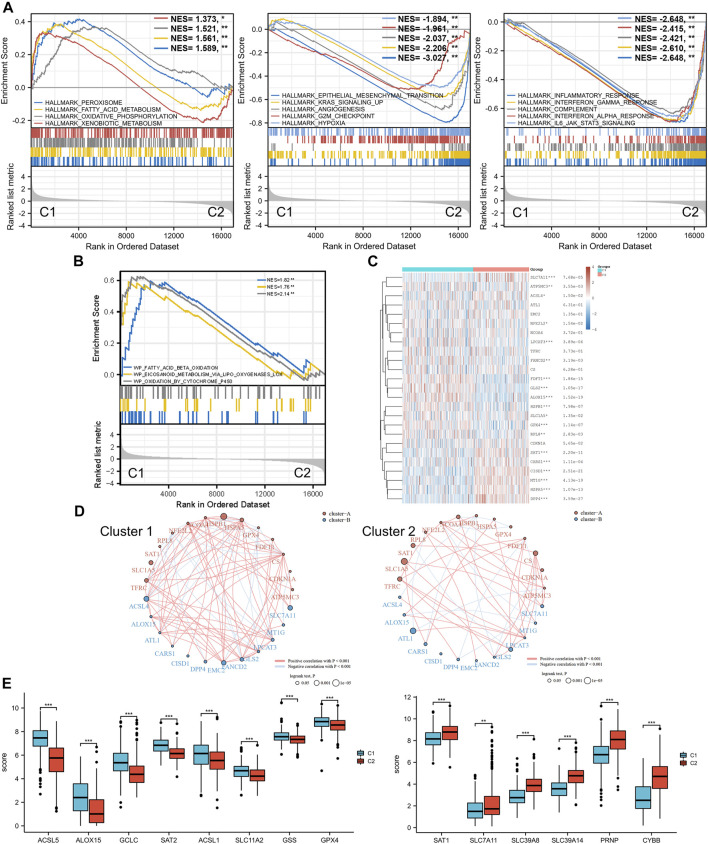
FIGURE 3.
Ferroptosis status analysis and GSEA results. (A) GSEA of DEGs that were upregulated in cluster 1 and cluster 2. (B) GSEA results of lipid oxidation metabolism terms. (C) Heatmap of ferroptosis-related gene expression in two different metabolic status clusters. (D) Ferroptosis-related gene interaction network. The red and blue lines represent the positive and negative correlation, respectively. The thickness of the line represents the correlation between the two genes. The larger circle indicates a more significant prognostic log rank p value. (E) Expression difference of ferroptosis-related genes between the two clusters. GSEA: gene set enrichment analysis. DEG: differentially expressed genes. *p < 0.05, **p < 0.01, ***p < 0.001.

