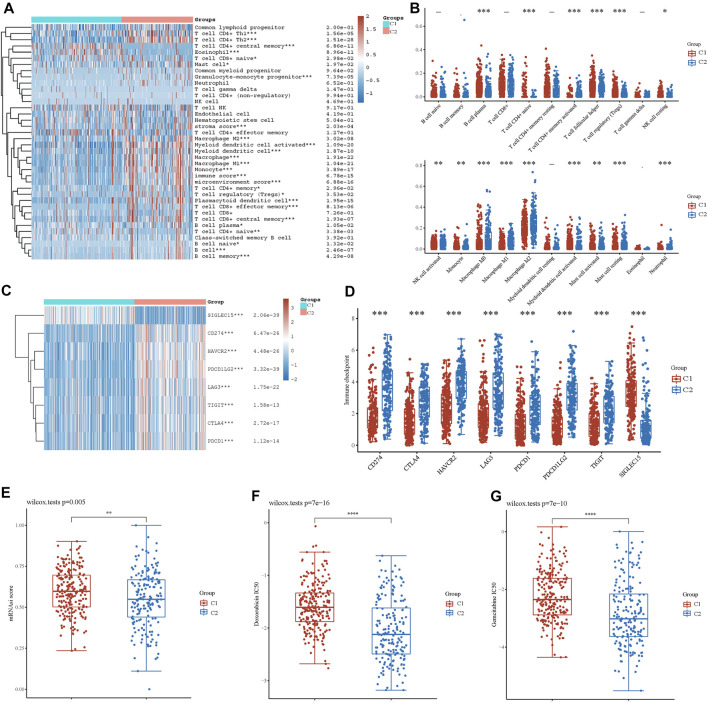
FIGURE 4.
Analysis of immune cell infiltration between two clusters. (A) Immune cell score heatmap by xCell algorithm. Red represents high expression/score, whereas blue represents low expression/score. (B) Boxplot of immune infiltration status in two clusters by the CIBERSORT algorithm. Heatmap (C) and boxplot (D) of immune checkpoint-related gene expression between two clusters. Cancer stem cell scores (E) and chemotherapy resistance to doxorubicin (F) and gemcitabine (G) of the two clusters. *p < 0.05, **p < 0.01, ***p < 0.001.

