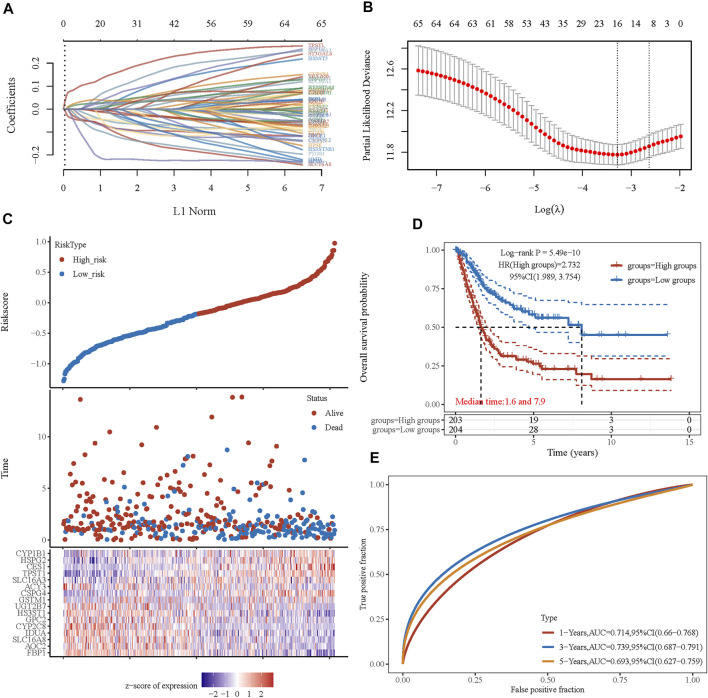
FIGURE 5.
Prognostic signature was established based on four prognostic energy metabolism-related genes. (A) LASSO coefficient profiles of the genes associated with the metabolism of BLCA. (B) Partial likelihood deviance is plotted versus log(λ). (C) The risk score of each sample based on the energy metabolism-related gene set. Patients were divided into low-risk and high-risk groups according to the median value of the risk score. The high/low expression levels of 16 genes which were involved in the prognostic signature are shown in red/blue in each sample. (D) The Kaplan–Meier curve of overall survival differences stratified by signature risk score. (E) The ROC curves of the signature for overall survival at 1, 3, and 5 years. LASSO: least absolute shrinkage and selection operator. ROC: receiver operating characteristic.

