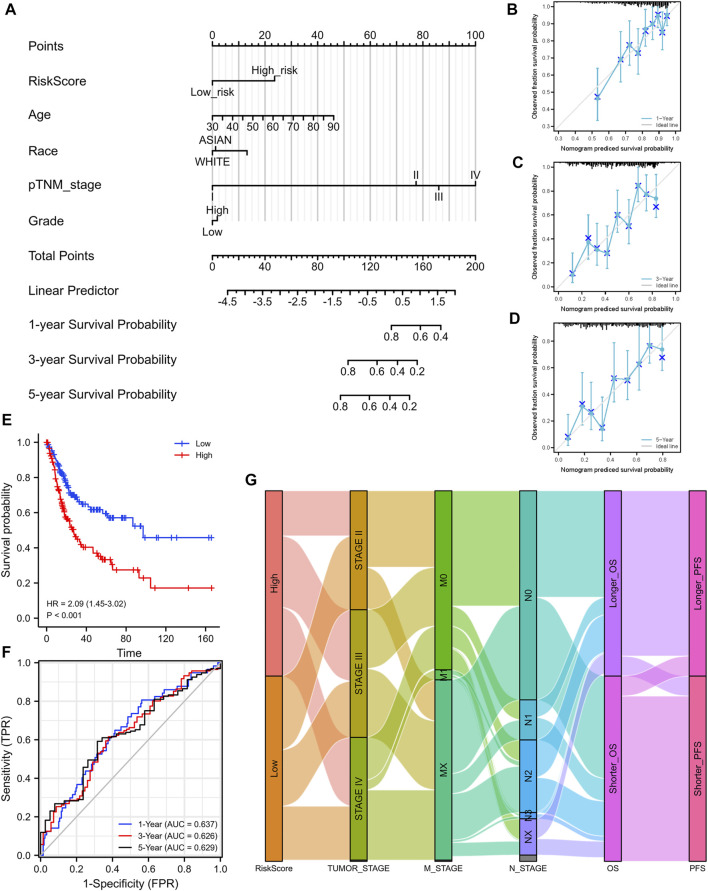
FIGURE 6.
Construction of a nomogram and the independent signature validation. (A) Nomogram for predicting 1-, 3-, or 5‐year OS in patients with BLCA. (B) The calibration plots for predicting 1-year OS. (C) The calibration plots for predicting 3-year OS. (D) The calibration plots for predicting 5-year OS. (E) Validation of the signature in overall survival based on data from the cBioPortal online database. (F) The ROC curves of the signature validation for overall survival at 1, 3, and 5 years. (G) Sankey diagram showing the association between signature risk scores and clinicopathological characteristics based on data from the cBioPortal database. OS: overall survival. ROC: receiver operating characteristic.

